The strategy that looks perfect on paper
You spend a weekend tweaking a Nifty intraday strategy. By Sunday night, the backtest shows a 78% win rate, smooth equity curve, and a max drawdown of just 4%. You go live on Monday. By Friday, you're down 6% and confused.
This is not bad luck. This is overfitting — when a strategy learns the noise in past data instead of any real market behaviour. The backtest didn't lie. It just answered a different question than the one you needed answered.
This post breaks down how overfitting hides inside good-looking backtests, the warning signs Indian retail traders should watch for, and the simple checks that catch most curve-fitted systems before they reach live capital.
What overfitting actually looks like
Overfitting happens when your rules are so closely tuned to historical data that they capture random fluctuations as if they were signals. The strategy memorises the past instead of learning a pattern that will repeat.
A simple example. Suppose you build a Bank Nifty strategy with these rules:
- Buy when 9 EMA crosses above 21 EMA
- Only between 10:17 AM and 10:43 AM
- Only if previous day's range was between 412 and 587 points
- Exit at 1.8% target or 0.6% stop loss
The 9/21 EMA crossover is a real pattern. The other three filters are almost certainly noise. You added them because removing any one of them dropped the win rate. That is curve fitting in action — each filter exists to delete losing trades from the sample, not because it reflects anything about how markets behave.
A clean strategy survives when you change the parameters slightly. An overfitted one collapses.
The seven warning signs
1. Too many parameters for the trade count
If your strategy has eight rules and the backtest only produced 60 trades, you have more knobs than data. Statistically, you can fit almost any small dataset perfectly with enough parameters. A rough rule: aim for at least 30 trades per parameter you tuned. A 4-parameter strategy needs 120+ trades minimum to mean anything.
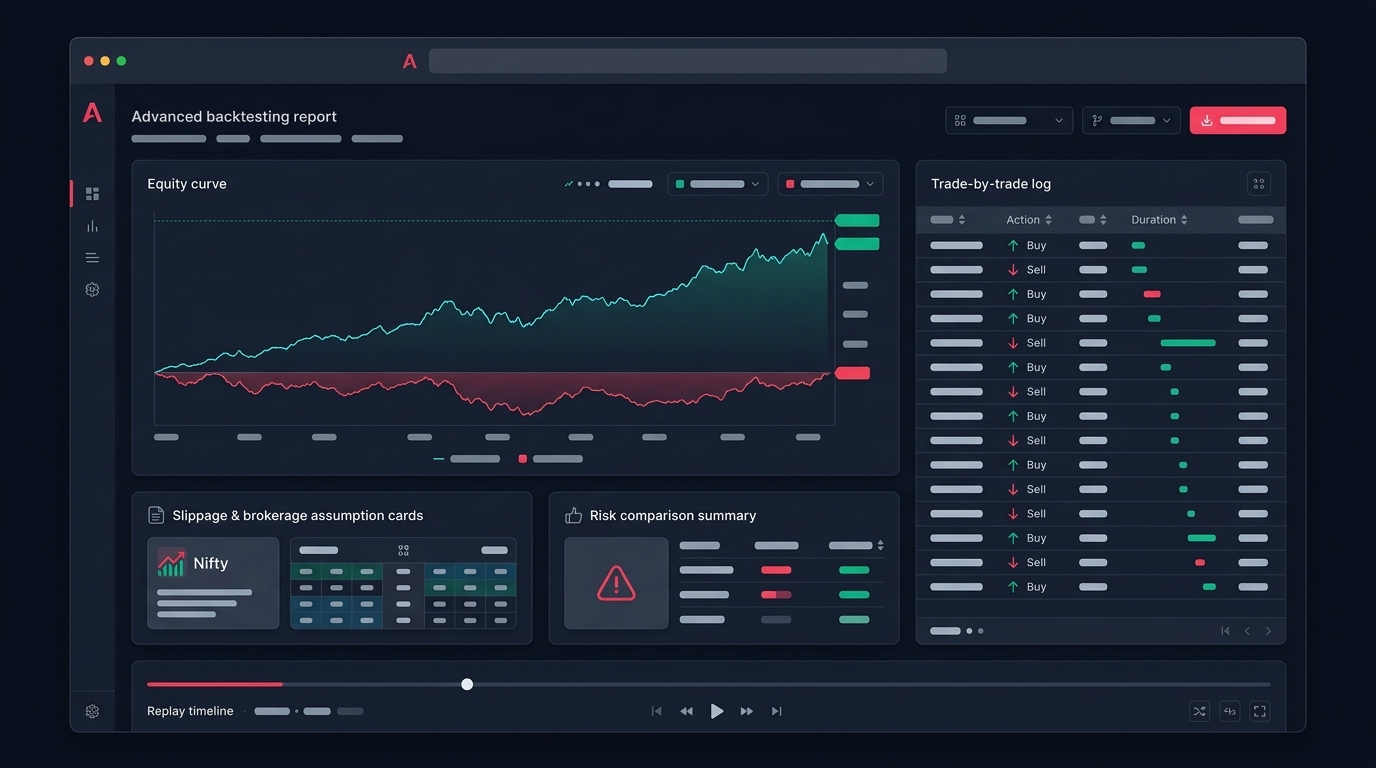
2. Suspiciously smooth equity curve
Real strategies have ugly stretches. Markets go through regimes — trending, choppy, low-volatility, panic. If your backtest shows a near-straight line going up-right with shallow drawdowns, something is fitted to the sample. A 70% win rate on options selling looks great until you remember that the 30% losers in real life include gap-down Mondays after a weekend event.
3. Performance dies on a small parameter change
Take your "best" parameters and shift them by 10%. If a 14-period RSI works beautifully but 13 and 15 both lose money, the 14 is a coincidence, not a signal. Robust strategies show a gentle hill of profitability around the optimal parameters, not a sharp spike.
4. Different time periods give wildly different results
Split your backtest into two halves. If the strategy made all its money in 2021 and lost in 2022-2023, you have a regime-specific edge that has likely already faded. The 2020 COVID volatility window made many momentum strategies look brilliant. Most of those edges were gone by 2022.
5. Heavy use of specific dates, days, or time windows
"Only trade Tuesdays between 11:00 and 11:45" rules are a red flag unless you have a structural reason — like the post-RBI-press-conference window or expiry-day behaviour. Otherwise, you're slicing the data until you find a lucky pocket.
6. The strategy needs the exact instrument
If your edge only works on Bank Nifty weekly options but breaks completely on Nifty or Fin Nifty, ask why. Sometimes there's a real reason (liquidity, volatility profile). Often it just means you optimised on one symbol and never tested elsewhere.
7. Costs were ignored or assumed away
This is the most common Indian-market trap. A 0.5% edge per trade vanishes once you account for STT, brokerage, exchange fees, GST, SEBI charges, and realistic slippage on Bank Nifty options. Many "profitable" intraday systems are loss-making once full costs are modelled. For deeper context on cost-aware testing, see our guide on options backtesting.
A practical test: walk-forward validation
The single most useful check is walk-forward testing. The idea is simple:
- Take data from Jan 2022 to Dec 2022. Tune your strategy on this window.
- Apply those exact frozen parameters to Jan 2023 to Jun 2023 — without retuning.
- Roll the window forward and repeat.
If the strategy keeps working on the unseen "out-of-sample" periods, you have something real. If it works only on the in-sample window and falls apart out-of-sample, you have an overfitted curve.
Most retail traders skip this step because it feels tedious. It is the single most reliable filter between a fantasy backtest and a strategy worth paper-trading.
How to design strategies that survive
A few habits that help:
Start with a hypothesis, not data mining. Write down why your edge should exist before you backtest. "Bank Nifty tends to mean-revert after a 1.5% gap because option sellers re-hedge" is a hypothesis. "I found a combination of indicators that worked" is data mining.
Use fewer parameters. Three rules with one parameter each beats seven rules with five parameters each. Simplicity is anti-overfitting armour.
Keep a holdout dataset. Take the last 6-12 months of data and never touch it during development. Only run your final strategy on it once. If you re-tune after seeing the holdout results, you've contaminated it.
Stress test with realistic costs. Model your actual brokerage plan, expected slippage (wider for OTM options, narrower for index futures), and assume the worst quote you'd realistically get. Conservative cost modelling is uncomfortable. It also separates real edges from accounting illusions.
Test across regimes. A good strategy should at least survive (not necessarily thrive) in different volatility regimes. If your VIX 11-13 strategy explodes when VIX hits 18, you don't have a strategy — you have a calm-market bet.
Cross-check with a scanner first. Before building a full backtest, use a stock scanner to see if your signal even appears frequently enough to matter. A condition that triggers four times a year cannot be statistically validated.
The honest expectations check
A real, tradable retail strategy in Indian markets usually has:
- Win rate between 40% and 65% (not 80%+)
- Max drawdown of 15-25% at some point (not 4%)
- Equity curve that is choppy with multi-month flat or down stretches
- Performance that degrades 20-40% from backtest to live, even when done well
If your backtest shows numbers far better than this, the burden of proof is on you — not on the market — to explain why your edge is so exceptional.
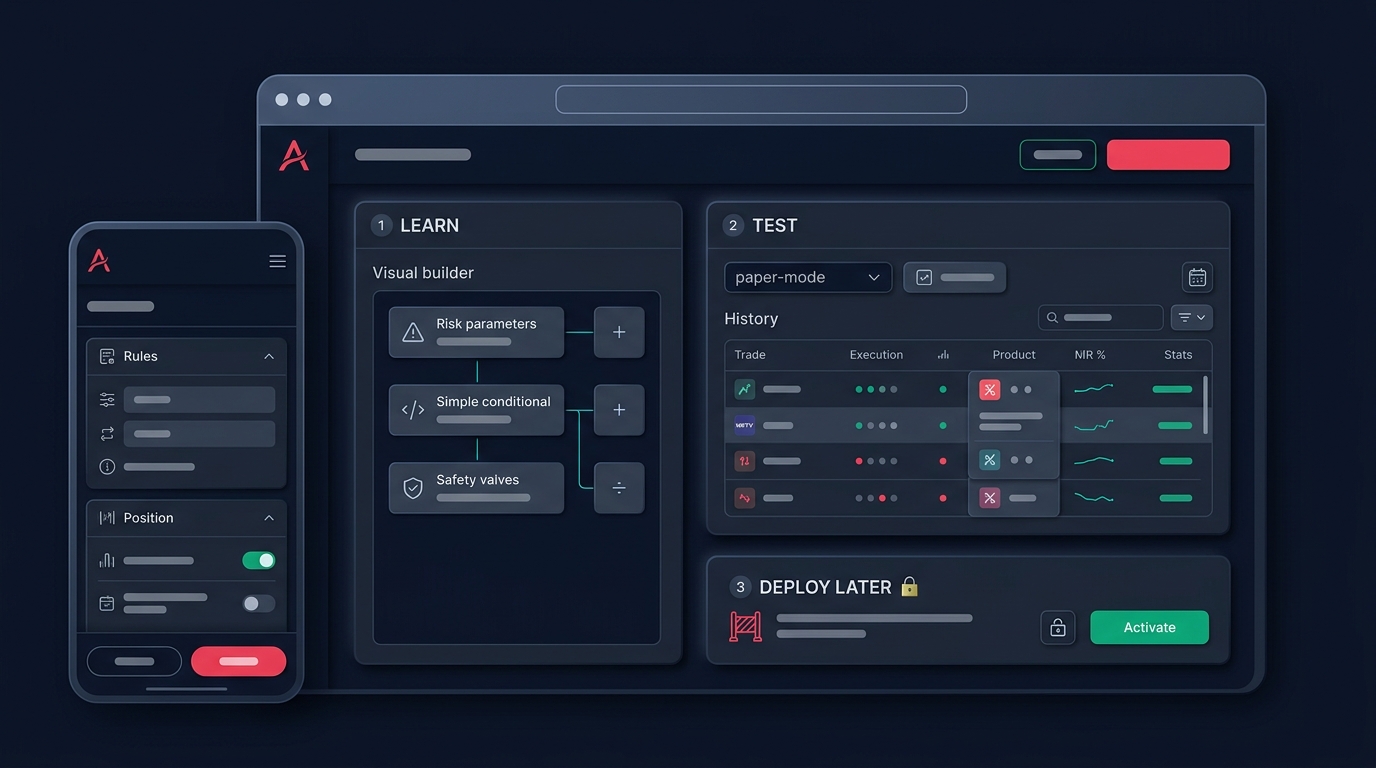
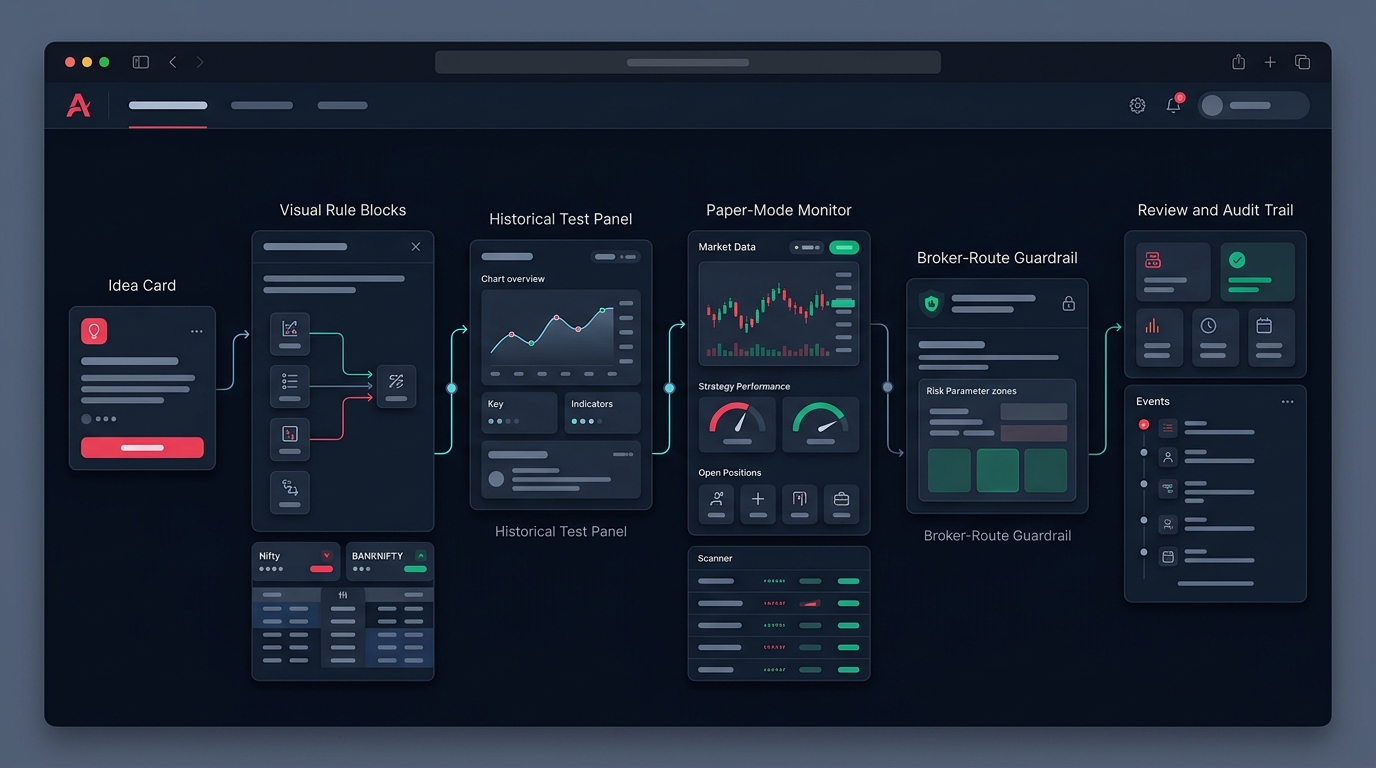
Tools like a no-code strategy builder make it tempting to iterate fast and over-optimise. The same speed that helps you test ideas can hurt you when you start tweaking until the curve looks pretty. Discipline matters more than tooling.
If you want to test these ideas with a workflow built around proper cost modelling, walk-forward windows, and honest assumptions, you can request early access.
A checklist before going live
Run every strategy through these questions before risking real capital:
- Do I have at least 30 trades per parameter I tuned?
- Does the equity curve have realistic drawdowns and choppy stretches?
- Do small parameter changes (±10%) still produce reasonable results?
- Does performance hold across at least two different yearly periods?
- Have I walk-forward tested on truly unseen data?
- Are full costs — brokerage, STT, exchange fees, GST, slippage — included?
- Have I papertraded for at least 4-8 weeks before committing capital?
- Can I explain why the edge exists in one sentence, without referencing the backtest?
If you can't answer yes to most of these, the backtest is a hypothesis, not a green light. The market will eventually charge tuition either way — better to pay it in paper trades than live ones.