A scanner is a filter, not a strategy. That single line saves more capital than any indicator setting you will ever tweak. Most retail traders in India treat a scanner hit as a green light to enter, when really it is just a starting point for further investigation.
This post walks through how to convert raw scanner output into actual trading rules you can backtest, monitor, and eventually automate.
Why scanner signals are not trading rules
A typical scanner condition looks something like: "Close above 20 EMA AND RSI above 60 AND volume above 1.5x of 20-day average." Run this on the NSE 500 and you might get 30-40 hits on a trending day, and 2-3 hits on a choppy day.
Here is the problem. The scanner tells you which stocks currently match a pattern. It does not tell you:
- Whether that pattern has historically led to profitable trades
- What stop-loss and target levels make sense
- Which market regime favours this setup
- How often the same condition gives false signals
A trading rule, by contrast, specifies entry, exit, position size, and the conditions under which the rule is paused. Scanner output is raw material. Trading rules are the finished product.
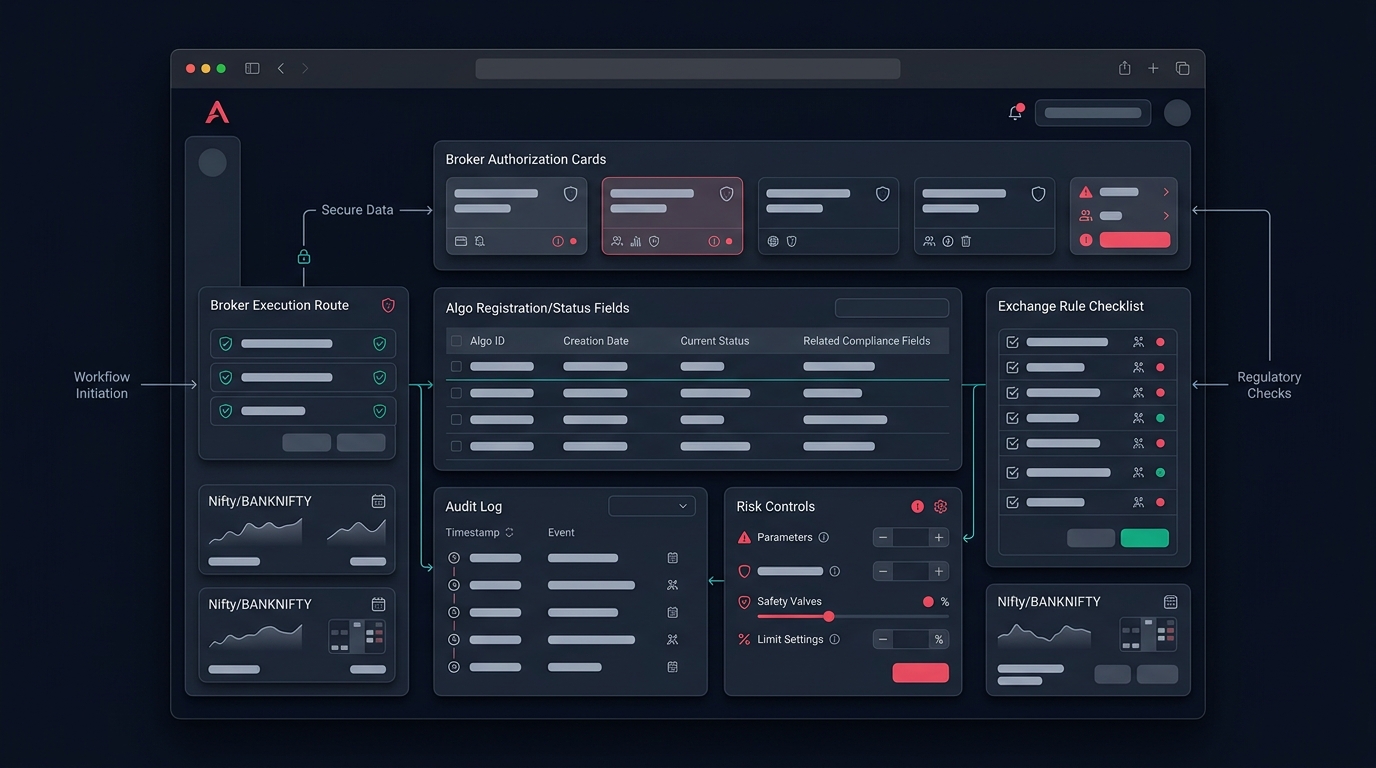
The validation pipeline
Think of the journey from scanner to live execution as a four-stage filter. Each stage removes signals that look good on the surface but fail under scrutiny.
Stage 1: Define the hypothesis
Before running a scanner, write down what you believe. Example: "Stocks breaking out of a 20-day high on above-average volume tend to continue in the breakout direction for 3-5 sessions."
This forces clarity. If you cannot state a hypothesis, you do not have a strategy — you have a hunch.
Stage 2: Add structural filters
Raw scanner output is noisy. Add filters that reflect market structure:
- Liquidity filter: average daily volume above a meaningful threshold (say, 5 lakh shares). Illiquid stocks slip badly during exit.
- Price filter: avoid penny stocks where 1-rupee moves distort percentage calculations.
- Sector concentration cap: do not let more than 2-3 hits from the same sector dominate your watchlist on a given day.
- Event filter: exclude stocks with results, ex-dividend, or corporate actions in the next 3 sessions.
These filters typically remove 40-60% of raw scanner hits. That is a feature, not a bug.
Stage 3: Backtest the surviving signals
This is where most retail workflows collapse. The scanner shows a pattern works "visually" on a recent chart, so the trader assumes it will keep working. A proper backtesting run on 2-3 years of data tells a different story.
Key metrics to check:
- Win rate: not the highest possible — look for stable win rate across different years
- Average win vs average loss: a 45% win rate with a 2:1 reward-to-risk often beats a 65% win rate with 1:1
- Maximum consecutive losses: how many drawdown trades in a row can you stomach
- Performance in different volatility regimes: does the system work when India VIX is above 18, or only in calm markets
If the backtest shows the scanner-driven signal has no edge over a buy-and-hold approach in the same period, the signal is not actionable. Drop it.
Stage 4: Paper trade before capital
Even a backtested signal needs forward validation. Live execution introduces slippage, partial fills, order rejections, and the simple psychological friction of clicking the button. Paper trade the rules for at least 20-30 signals before risking real money. Anadi Algo's paper trading lets you simulate the full workflow against live ticks without committing capital.
A worked example
Suppose your scanner flags 12 stocks today that meet "close above 50 DMA, RSI between 55-70, volume above 1.5x average." Here is how the pipeline narrows it down:
| Stage | Signals remaining |
|---|---|
| Raw scanner output | 12 |
| After liquidity + price filters | 8 |
| After sector cap (max 2 per sector) | 6 |
| After event filter (results in next 3 days) | 4 |
| Signals matching backtested edge zone | 3 |
| After position-size cap (max 5% capital per trade) | 3 trades sized appropriately |
You went from 12 raw hits to 3 sized, validated trades. That filtering discipline is what separates a scanner user from a systematic trader.
Common mistakes when converting signals to rules
Optimising on the same data you scanned. If you tweak parameters until the backtest looks pretty on the last 6 months, you are curve-fitting. Always reserve an out-of-sample period.
Ignoring transaction costs. Brokerage, STT, exchange fees, and slippage can quietly eat 0.3-0.5% per round trip. A strategy with a 0.4% average edge per trade is not profitable after costs.
No exit rule. Many traders define an entry trigger from the scanner but improvise the exit. Exits should be as systematic as entries — fixed stop-loss, trailing stop, time-based exit, or signal reversal.
Skipping the regime check. Trend-following scanners get destroyed in range-bound markets. Mean-reversion scanners get destroyed in strong trends. Add a risk management layer that pauses the strategy when its assumed regime is absent.
When are signals ready for automation
A scanner-derived rule is ready for automation only when:
- It has been backtested across at least two market regimes (a trending year and a sideways year).
- The rule set is fully specified — no manual judgment required at entry or exit.
- Paper trading has confirmed the live behaviour matches the backtest within reasonable slippage.
- You have defined a kill-switch: a drawdown level, a volatility threshold, or a consecutive-loss count that pauses the strategy automatically.
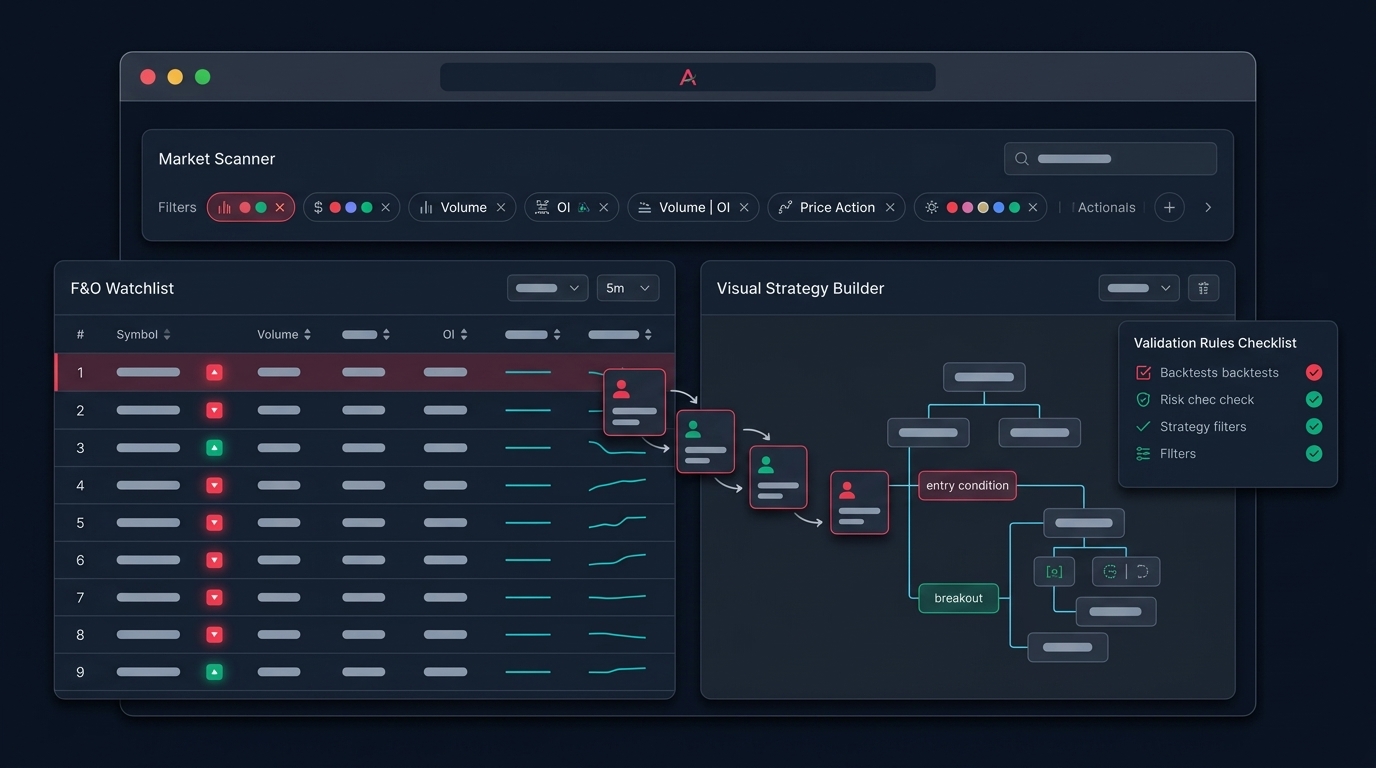
Anadi Algo's stock scanner is built to push validated conditions directly into a watchlist or strategy slot, so you can carry the same condition logic from research to execution without rewriting it. The point is not to skip the validation steps — it is to make sure none of them get lost in translation between tools.
Quick checklist before turning a scanner into a live rule
- Written hypothesis the scanner is testing
- Liquidity, price, sector, and event filters applied
- Backtest on 2+ years, including a non-trending period
- Win rate, reward-to-risk, max consecutive losses documented
- Transaction costs included in backtest
- Exit rules defined as precisely as entry rules
- At least 20 paper trades completed
- Kill-switch and regime filter in place
If you want to put this workflow into practice end-to-end — scanner, backtest, paper trade, automate — sign up for early access and try the full pipeline on your own ideas.
Scanners are powerful, but only when they feed a disciplined process. Treat every signal as a candidate, not a command, and your conversion rate from raw hit to profitable trade improves dramatically.