Your backtest shows a 68% win rate and a smooth equity curve. You go live with real capital. Three weeks later you are down and confused. Nothing about the market changed — so what broke?
Usually one thing: the strategy was tuned to fit the past, not built to survive the future. Walk-forward testing is the simplest, most honest defense against that trap. If you do any backtesting on Indian instruments, this is the discipline that separates a real edge from a flattering curve.
What walk-forward testing actually is
A normal backtest runs your strategy over one long block of history — say Nifty from 2021 to 2025 — and reports one set of numbers. The problem is that you also chose your parameters by looking at that same block. So of course it looks good. You optimized on the answer sheet.
Walk-forward testing splits your data into two roles:
- In-sample (train): the window where you are allowed to optimize parameters.
- Out-of-sample (test): the window the strategy has never "seen," used only to check performance.
You tune on train, then measure on test. If the edge holds on data the optimizer never touched, you have a real signal. If it collapses, you found noise.
The "walk-forward" part means you do this repeatedly, rolling forward in time:
- Train on Jan–Jun, test on Jul–Sep.
- Train on Apr–Sep, test on Oct–Dec.
- Train on Jul–Dec, test on Jan–Mar of the next year.
Each test window simulates how the strategy would have behaved on genuinely unseen market data. Stitch all the test windows together and you get an out-of-sample equity curve — the only curve worth trusting.
Why over-optimized parameters fail
Say your strategy has a moving-average crossover with a stop and a target. You run a grid: fast MA from 5 to 50, slow MA from 20 to 200, stop from 0.5% to 3%. Somewhere in that grid sits a combination that produced a beautiful return on 2021–2024 Bank Nifty.
That "best" combination did not find a market truth. It found the specific sequence of wiggles in that exact history. Change the period slightly and the optimal numbers move. That is the signature of curve fitting.
A few rules of thumb that hold up in practice:
- More parameters means more overfitting risk. A strategy with two knobs is far harder to fool yourself with than one with eight.
- A single magic value is a red flag. If 14 works brilliantly but 12 and 16 are losers, you are sitting on a spike, not a plateau. Robust parameters work across a range of nearby values.
- In-sample numbers are marketing; out-of-sample numbers are reality. Expect out-of-sample results to be meaningfully worse. A strategy whose test performance is close to its train performance is more trustworthy than one with a dazzling train curve and a weak test curve.
How to run a walk-forward test in practice
You do not need a PhD or expensive software. You need discipline about windows.
Choose anchored vs rolling
- Rolling window: train length stays fixed (e.g. always 6 months) and slides forward. Good when you believe recent behavior matters most.
- Anchored window: train start stays fixed and the window keeps growing. Good when you want the model to learn from all available history.
For Indian index strategies, a rolling window often makes more sense because volatility regimes shift — a calm 2023 stretch behaves very differently from an event-heavy budget or election period.
Pick honest window sizes
Match the window to your trade frequency. An intraday Nifty strategy might generate hundreds of trades in three months, so short test windows are fine. A swing strategy on stock F&O might need a year of test data just to collect enough trades to mean anything. A test window with eight trades tells you nothing — that is luck, not evidence.
Keep the rules fixed inside each test
Once a test window starts, no peeking and no tweaking. The moment you adjust a parameter because the test month looked bad, you have contaminated it back into in-sample. This is where most retail backtests quietly cheat.
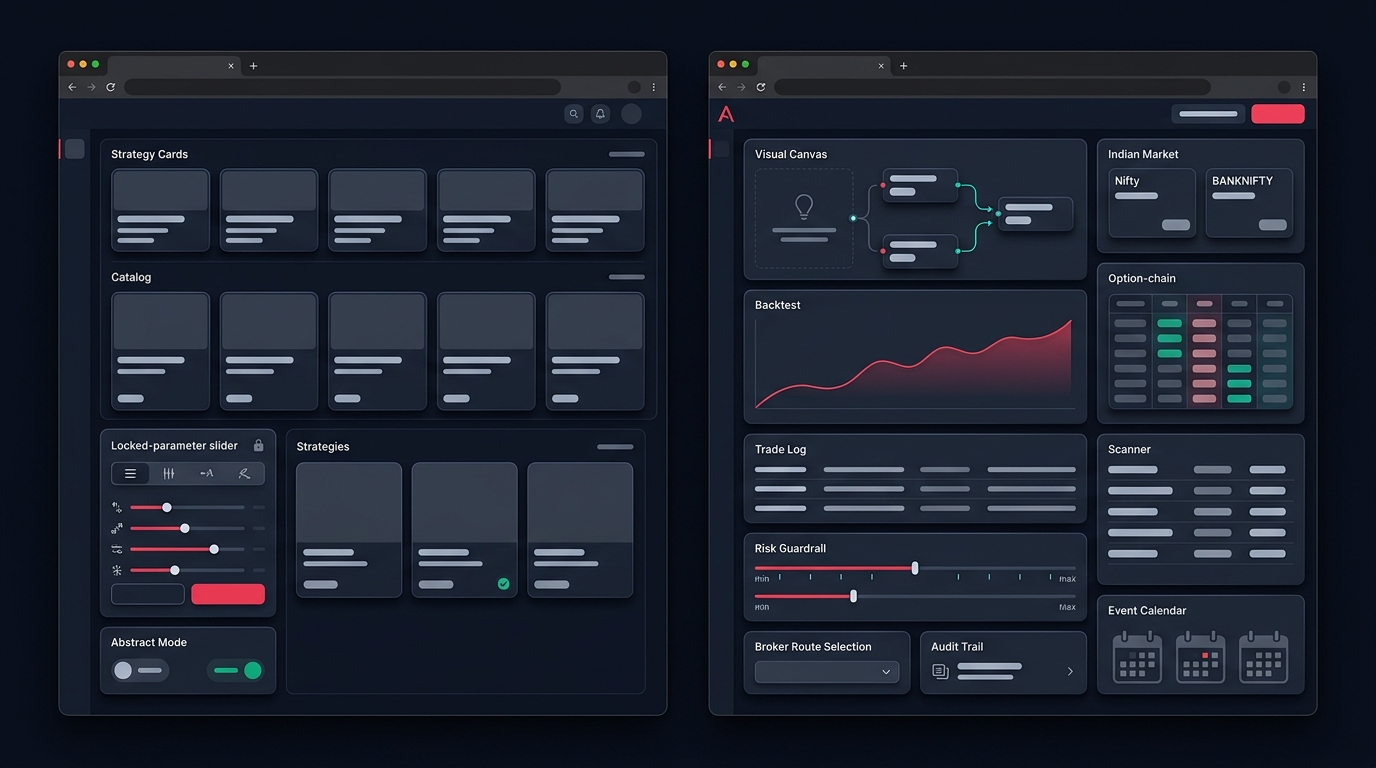
In Anadi's New Backtest wizard, you can set the date window, timeframe, fill model, fees, and SL/TP explicitly, then re-run the same strategy builder logic across different periods. That makes it straightforward to run train and test windows as separate, clearly labelled backtests instead of one big flattering run.
The assumptions that quietly inflate results
Walk-forward testing fixes the parameter lie. But two other lies can still make even an out-of-sample curve look better than reality.
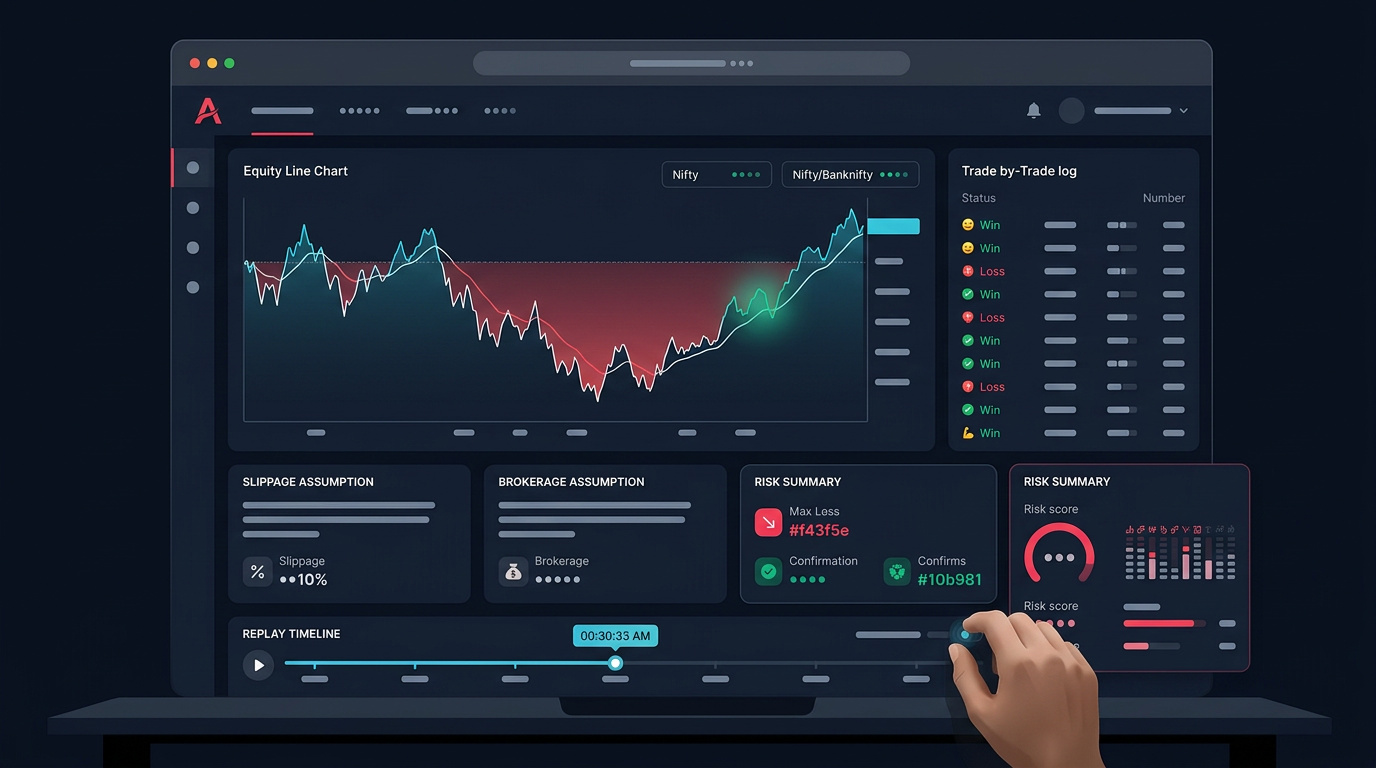
Costs. Brokerage, STT, exchange fees, GST, and stamp duty add up fast, especially on high-frequency intraday systems. A strategy that "works" before costs can be a net loser after them. Always test with realistic fee assumptions in basis points, not zero.
Slippage and fills. Backtests assume you got filled at the signal price. In live Bank Nifty options, a fast move means your fill is worse — sometimes much worse. Model slippage conservatively. On illiquid strikes or far OTM options, assume the spread works against you on both entry and exit.
A simple sanity check: take your out-of-sample profit and ask what happens if you double your assumed costs and add a tick of slippage per leg. If the edge survives that stress, you have something. If it vanishes, you were trading the backtest's optimism, not a real edge. This matters even more for multi-leg option strategies, where small per-leg costs compound across the basket.
A practical walk-forward checklist
Before you trust any backtest enough to risk capital, run through this:
- Did you split data into separate train and test windows, and only optimize on train?
- Did you roll the windows forward and stitch the test results into one out-of-sample curve?
- Do your best parameters sit on a stable plateau, not a lonely spike?
- Is the test-window performance within a sane distance of the train-window performance?
- Are there enough trades per test window to be statistically meaningful, not just a handful?
- Did you include realistic brokerage, taxes, fees, and slippage?
- Does the edge survive a stress test of doubled costs?
- Have you paired this with sensible risk management — fixed risk per trade and a hard daily loss limit — before going live?
None of this guarantees future profit. Markets change, regimes break, and no backtest can promise tomorrow. But walk-forward testing moves you from "this looked amazing on one chart" to "this held up on data it had never seen" — which is a far more honest place to start from.
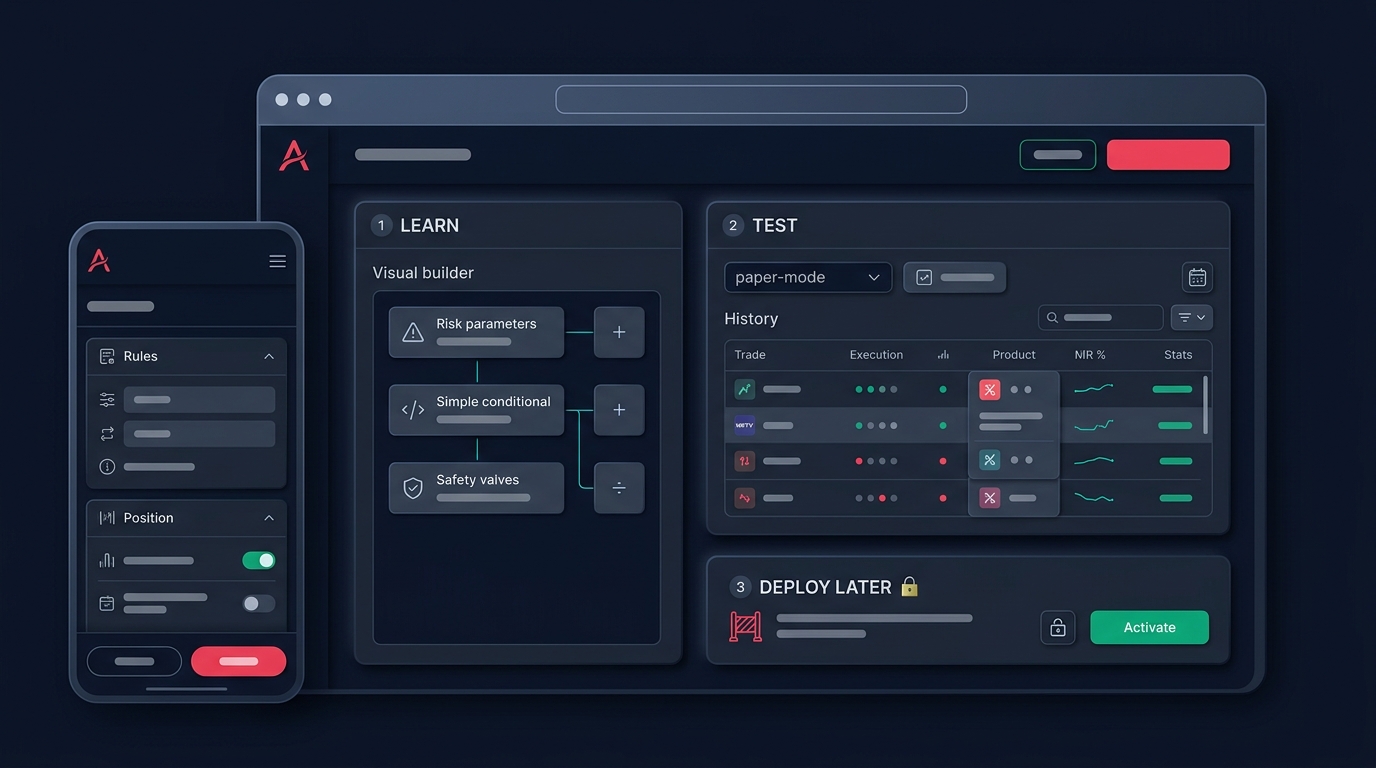
If you want to run train and test windows, model fills and costs, and move validated ideas toward paper and live execution in one place, you can get early access to Anadi Algo and try the workflow on your own strategies.
The goal is not a perfect backtest. It is a backtest you have actively tried to break — and one that survived.