Most retail option sellers treat expiry day like any other trading session. They run one backtest across all days, see a healthy equity curve, and assume the strategy works. Then live trading on a Tuesday afternoon wipes out two weeks of profits in 40 minutes.
The problem is not the strategy. The problem is that expiry day behaves nothing like a regular trading day, and a single combined backtest hides the difference.
This post is about why expiry-day behaviour needs its own backtest, what assumptions break, and the checks you should add before trusting any expiry-day P&L curve.
Why expiry day is a different market
On expiry day, three forces dominate price action that barely matter on other days.
Theta acceleration. Premium decay on the final session is non-linear. By midday, weekly options can lose 70 to 80 percent of their remaining time value in just a few hours. This is great for sellers — until it isn't.
Gamma risk. As options approach expiry and the underlying hovers near a strike, the option's delta swings violently. A 30-point move in BANKNIFTY can flip a 30-delta option into a 70-delta option in minutes. Stop-losses that worked on a Monday simply do not respond fast enough on a Tuesday.
Pin risk and OI defence. Strikes with heavy open interest tend to act like magnets. Market makers and institutional sellers defend these levels, and price often spends the last hour bouncing around them. A strategy that assumes "trend following" on expiry day will get chopped repeatedly.
A regular Monday backtest does not teach your model any of this. You have to test expiry days in isolation.
What a "combined" backtest hides
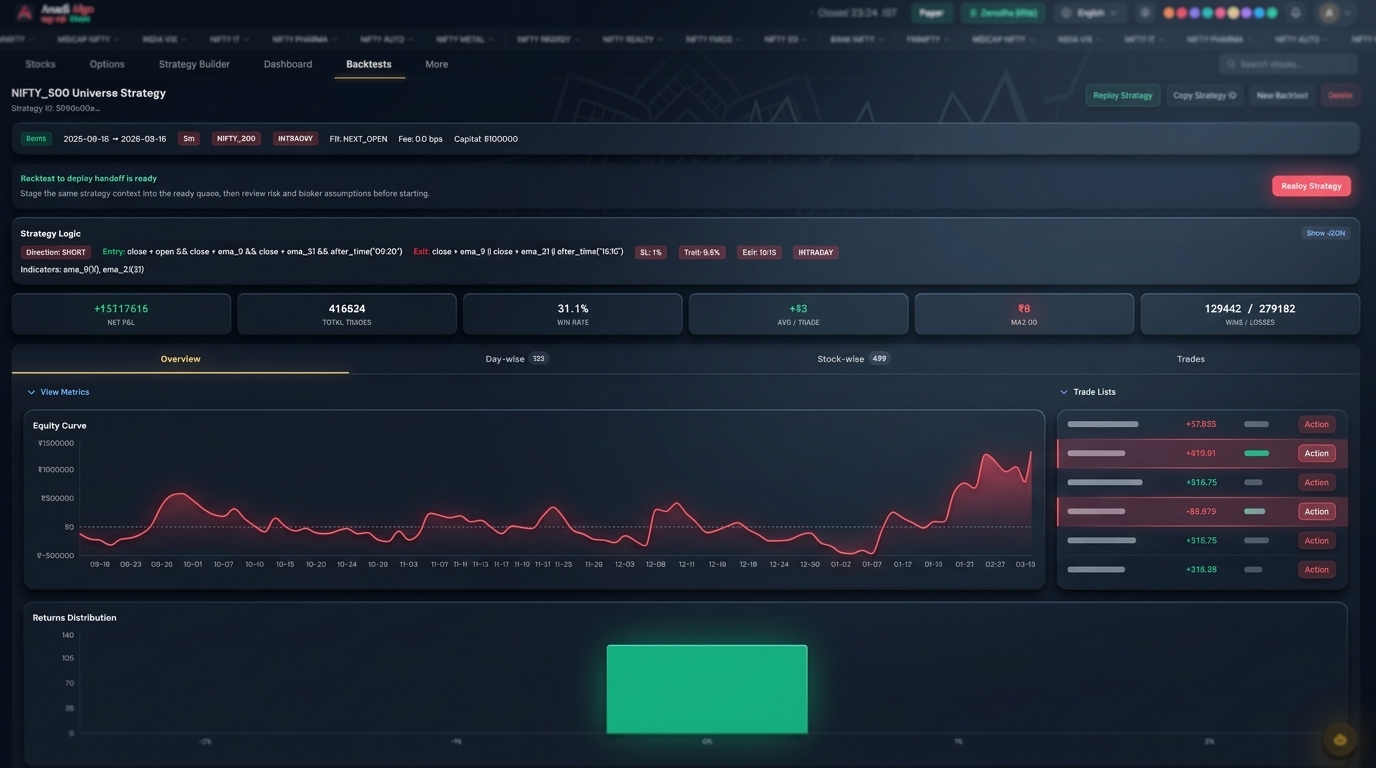
Suppose you build a short straddle strategy and backtest it across the last two years. Equity curve goes up. Sharpe looks decent. You feel ready.
Now split the same trades by day-of-expiry. Three things usually fall out:
- The bulk of your "edge" is concentrated on Wednesday-to-Monday, where vol is sticky and theta is steady.
- Expiry day shows a small number of large losses that the average obscures. Win rate on expiry day might be 80 percent, but the 20 percent of losing days produce drawdowns 3 to 5x larger than non-expiry losses.
- Slippage and stop-loss execution on expiry day are materially worse, and most generic backtests do not model this.
When you average all of it together, the curve looks fine. When you live-trade it, expiry day is where the account bleeds.
Assumptions that break on expiry day
Before you trust an expiry-day backtest, audit these assumptions one by one.
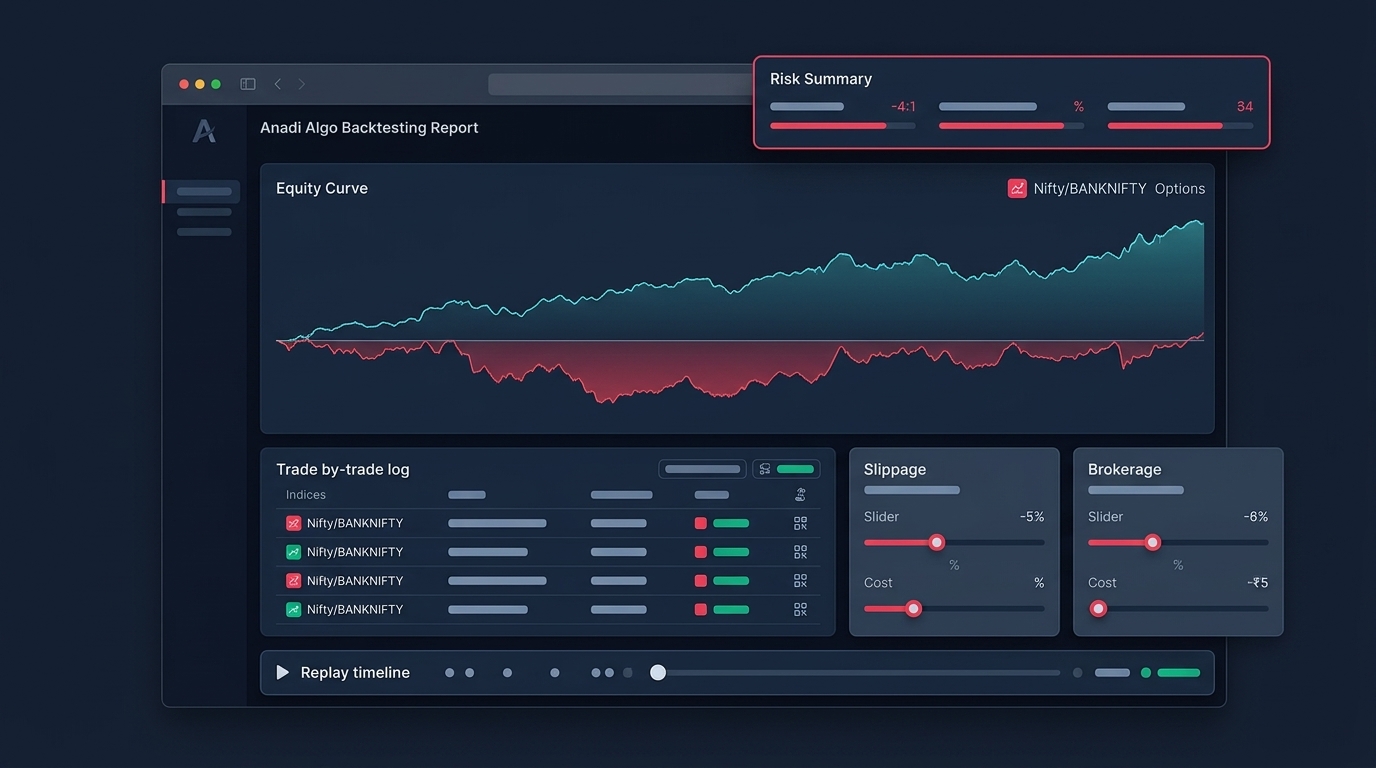
Slippage
A common backtest mistake is using last-traded-price (LTP) for fills. On regular days, with deep OI strikes, this is roughly okay. On expiry day, the bid-ask spread on out-of-the-money strikes can widen to 1 to 3 rupees on a 5-rupee premium — that is 20 to 60 percent of the option's value.
If your backtest assumed LTP fills, your real P&L will be worse by a meaningful margin. Re-run with conservative fill assumptions: mid-price minus half the spread for entries, mid-price plus half the spread for exits, and add a buffer for stop-loss triggers.
Stop-loss execution
Stop-losses on expiry day rarely fill at the trigger price. When BANKNIFTY moves 200 points in two minutes, a market stop on a short option can fill 30 to 50 percent above the trigger. Limit stops can simply not fill at all and turn into runaway losses.
Your backtest needs to model this. Either widen stop-loss assumptions, or simulate market-order fills with explicit slippage, or both.
Costs
Brokerage, STT, exchange fees, GST, and stamp duty add up. For high-frequency expiry-day strategies that scale in and out, costs can eat 15 to 25 percent of gross P&L. If your backtest only models brokerage and ignores STT on the sell side of options, your numbers are inflated. STT on options selling on exercise is especially nasty — many backtests miss it entirely.
Liquidity at far strikes
Far OTM strikes that look attractive on a chart often have abysmal liquidity in the last hour of expiry. A backtest using historical option chain data assumes you could trade at those prices. In reality, you might not get filled at all, or you get filled deep inside the spread.
IV crush
Premiums on expiry day fall hard from IV crush — sometimes 20 to 30 percent even without underlying movement. This benefits sellers but creates a false sense of safety. Strategies that "wait for premium to come back" do not work on expiry day. The premium is not coming back.
Practical checks before trusting an expiry-day backtest
Run this checklist on any expiry-day strategy you plan to deploy:
- Segment your results. Show P&L grouped by weekly expiry day vs. non-expiry days vs. monthly expiry day separately. Monthly expiries (last Tuesday) often behave differently from weekly expiries.
- Show worst expiry days. List the 5 worst expiry-day drawdowns over the test period. If any single expiry day represents more than 2x your daily risk budget, the strategy is not ready.
- Stress slippage. Add 0.5 to 1 rupee of slippage per leg per trade. Does the curve still go up?
- Stress stop-loss fills. Assume stops fill 25 percent worse than trigger price on expiry day. Re-run.
- Account for STT on settlement. If positions are held to expiry and go ITM, model the STT-on-exercise cost properly.
- Look at gamma exposure at entry. A short straddle entered at 11 AM on expiry has very different gamma than the same straddle entered at 9:30 AM. Tag each trade with entry-time gamma and check if losses concentrate at high-gamma entries.
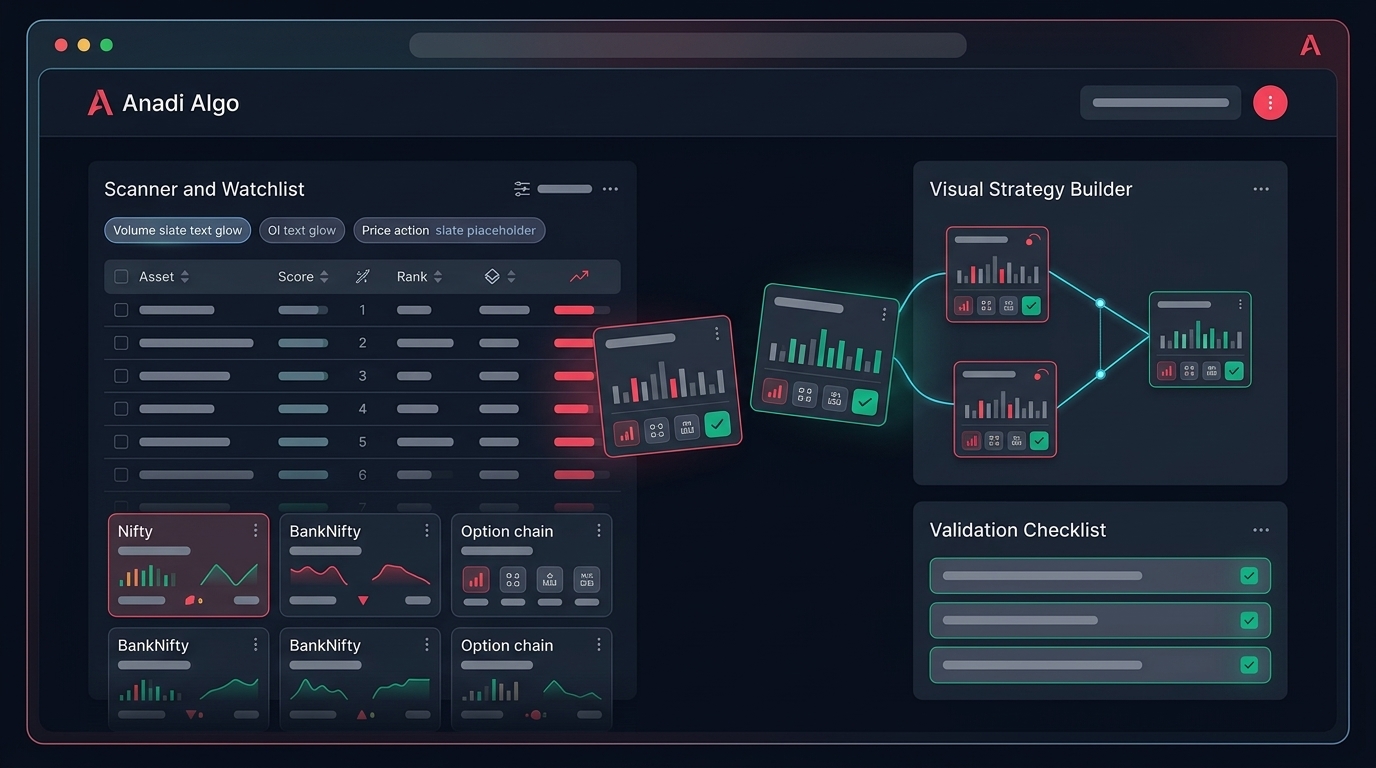
If you are testing on a platform like Anadi Algo's options backtesting tool, segment expiry days as a separate run and verify that fill assumptions reflect realistic option chain spreads, not just LTP.
Building a separate expiry-day model
The cleanest approach is to treat expiry-day trading as a different strategy from the rest of the week.
Use one logic for Monday-Friday non-expiry days, where theta is steady and gamma is manageable. Use a different logic — usually with smaller size, tighter time-based exits, and wider stop-losses — for expiry days. Backtest each independently.
A no-code strategy builder can help here because you can clone the same base strategy, add an "expiry day only" filter, and tune parameters separately without rewriting code.
For BANKNIFTY specifically, the monthly expiry on the last Tuesday tends to be more volatile than the regular weekly cycle, since institutional rolls concentrate there. Treat the monthly expiry as yet another bucket if your sample size allows.
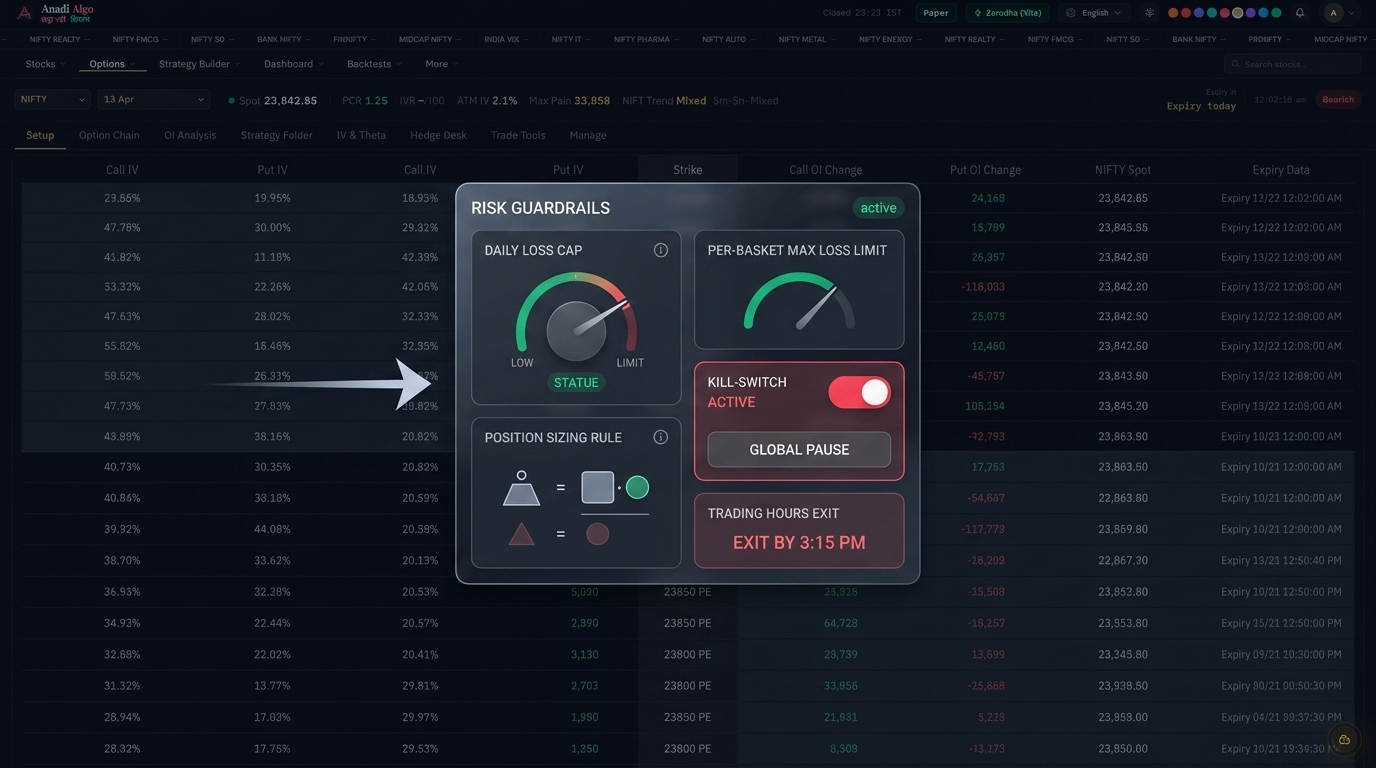
Position sizing on expiry day
Even with a clean backtest, position sizing on expiry day should be smaller than on regular days for one reason: the tail risk is fatter. A 1-in-50 event on a regular day might cost you 1.5x daily risk. A 1-in-50 event on expiry day can cost 4x or 5x. Size for the tail, not the average.
Many experienced sellers cap expiry-day exposure at 40 to 50 percent of their normal size. This is a sensible starting point. Refine it from your own backtest's drawdown distribution, not from gut feeling.
Checklist before going live
- Backtest expiry days separately from non-expiry days.
- Use realistic spreads, not LTP, for fill simulation.
- Model STT, brokerage, and slippage on every leg.
- Stress stop-loss fills assuming 20 to 30 percent worse than trigger.
- Inspect the 5 worst expiry days individually — understand what went wrong on each.
- Cap expiry-day position size below your regular sizing until you have at least 30 to 50 expiry-day trades of live data.
- Paper-trade the strategy for at least 4 to 6 expiry sessions before risking capital.
If you want to test expiry-day logic on real option chain data with proper cost modelling, you can request early access to try it on a clean sandbox before committing capital.
Expiry day is where retail option sellers get trapped because the rest of the week feels easy. A separate backtest, honest assumptions, and smaller size are the difference between a strategy that survives and one that gives back six months of profit in a single Tuesday afternoon.