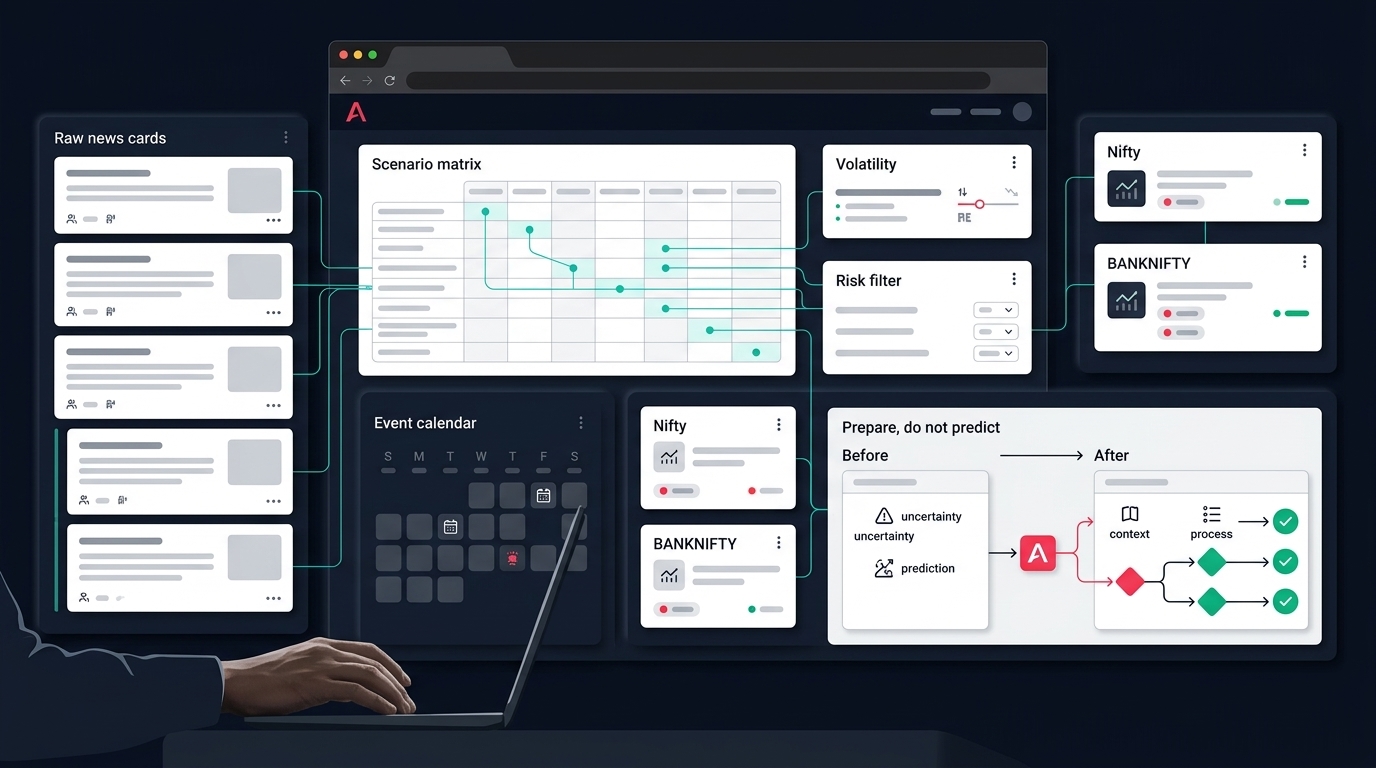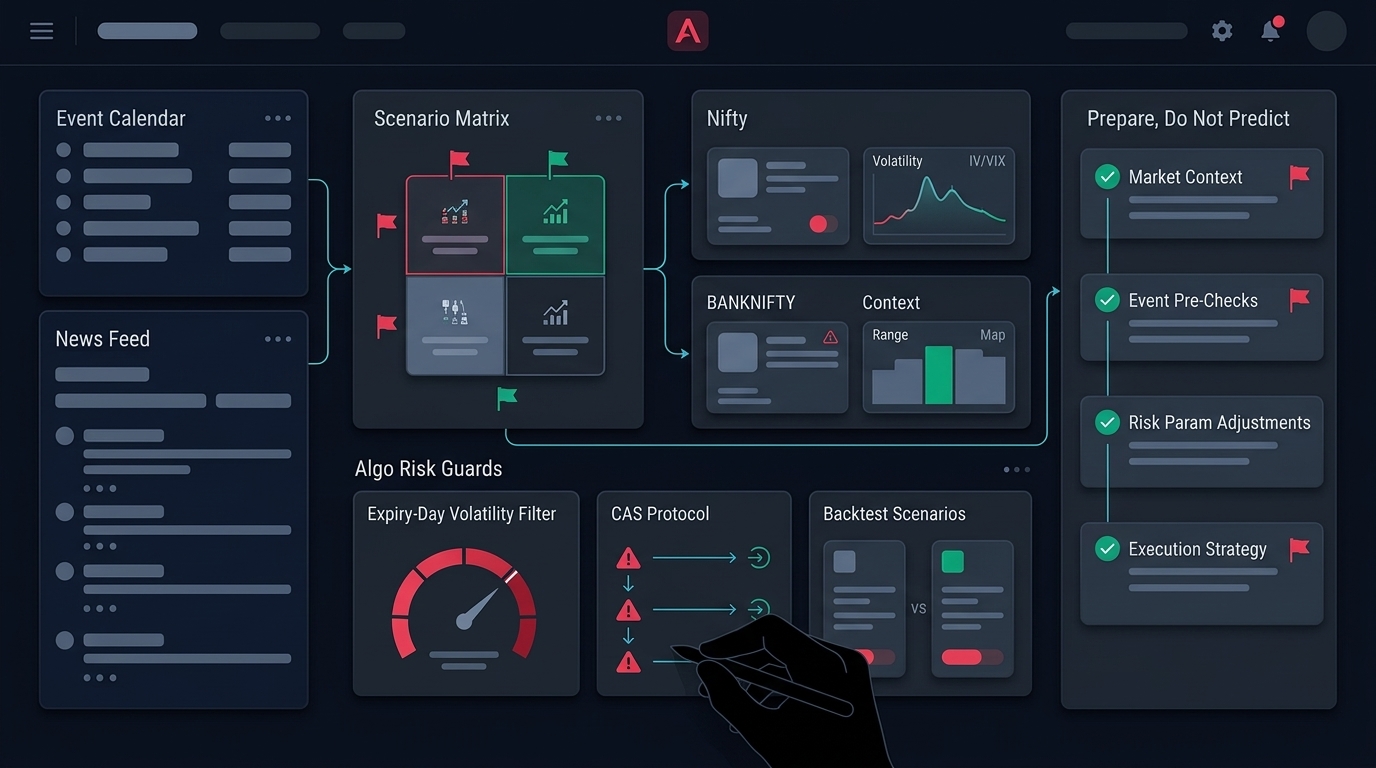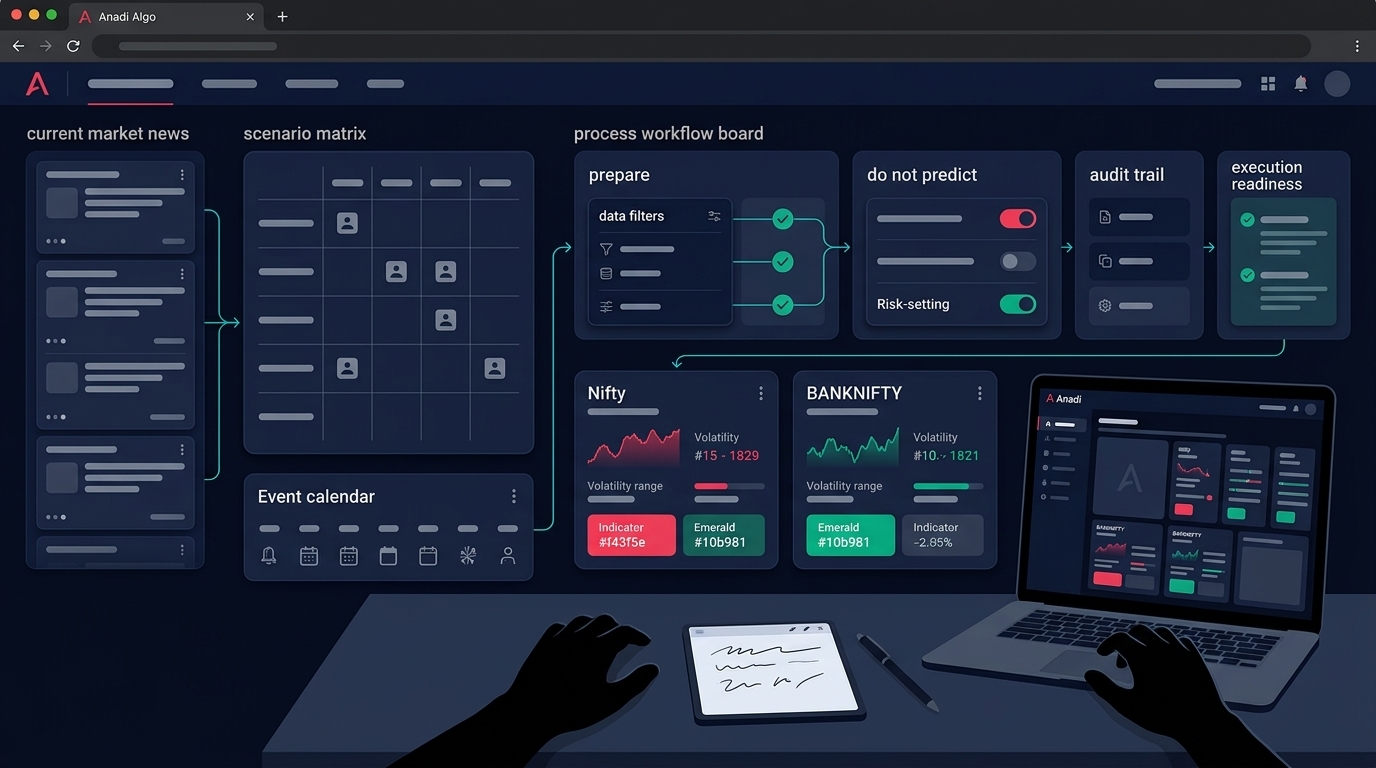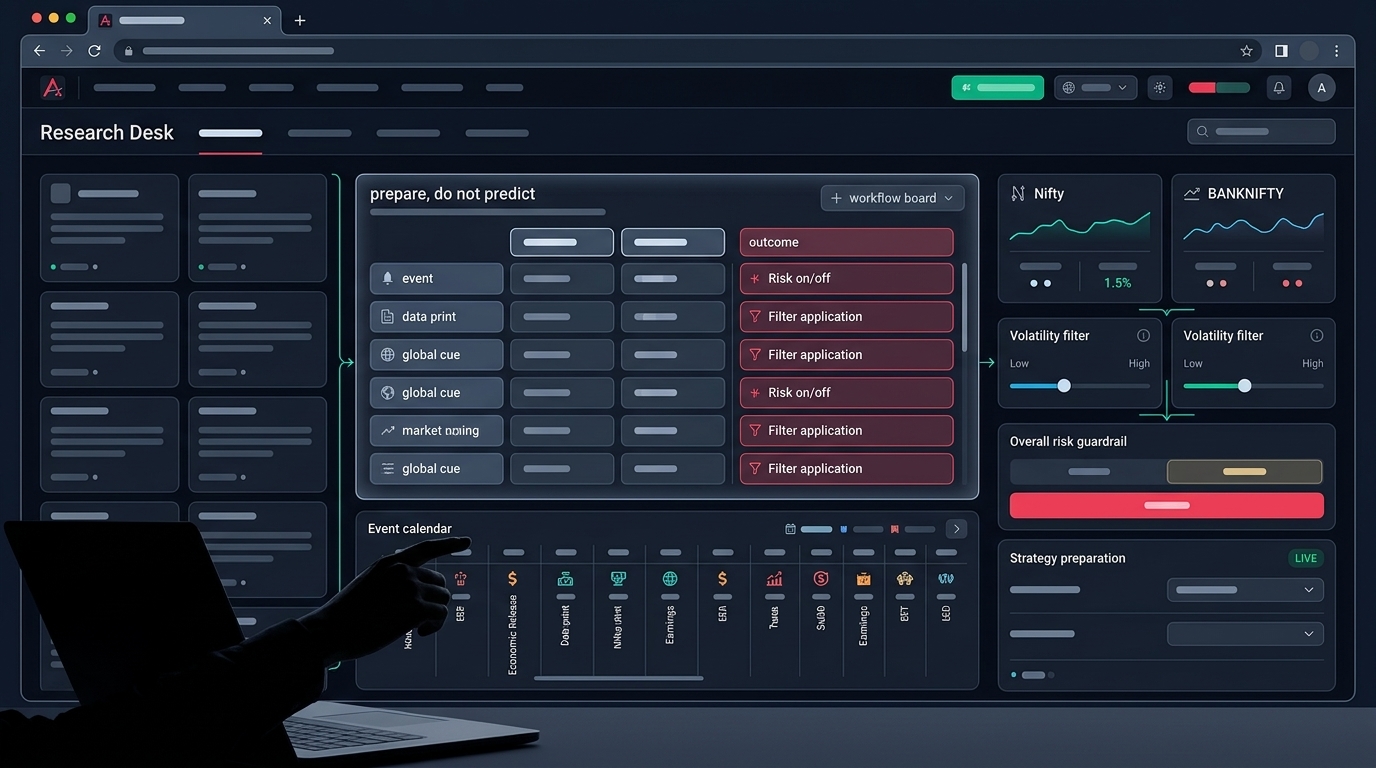
Most retail algo traders treat BANKNIFTY as a ticker on a chart. NSE treats it as a contract with a lifecycle — a trading cycle, an expiry rule, a strike-introduction schedule, and a constituent list that gets reviewed. The gap between those two views is where a lot of live-versus-backtest divergence actually lives.
This post walks through what the Nifty Bank F&O structure means for your process on a working week like this one (today is Thursday, 22 October 2026). No calls, no levels, no view. Just the contract mechanics, the concentration problem, and the checks worth wiring into your system before the next series rolls.
Nifty Bank is a sector bet wearing an index costume
Nifty Bank — officially the Nifty Bank Index — tracks a basket of the most liquid large-cap banking stocks on NSE. The usual names in that basket include HDFC Bank, ICICI Bank, State Bank of India, Kotak Mahindra Bank, Axis Bank, Bank of Baroda, Punjab National Bank, IndusInd Bank, Federal Bank, IDFC First Bank, Bandhan Bank and AU Small Finance Bank, though the exact composition is reviewed periodically by the index provider.
That is the whole story in one line: Nifty 50 spreads across many sectors, Nifty Bank does not. Every constituent sits in the same sector, exposed to the same drivers — RBI policy and liquidity decisions, credit growth data, quarterly asset-quality disclosures, and global rate moves.
So when people describe Bank Nifty as "more volatile," that is not a personality trait. It is concentration. A single-sector index with a small constituent count reprices faster because its components move together on the same news. Education sources commonly describe surprise policy outcomes moving the index by a few percent within minutes.
Practical consequence for an algo: your index-level filters are structurally blind to constituent-level events. A momentum rule reading only BANKNIFTY price does not know that a heavyweight bank reports results tomorrow morning.
The contract layer most algos quietly ignore
Pull up the NSE Nifty Bank F&O page and read it as a spec sheet, not as reference trivia.
Trading cycle and the day-after-expiry strike refresh
BANKNIFTY futures run a maximum three-month trading cycle — near month, next month and far month. A new contract is introduced on the trading day following the expiry of the near month contract.
The options side matters more for most retail systems. On expiry of the near month contract, new contracts are introduced at new strike prices for both call and put options, on the trading day following that expiry.
Read that again if you cache instrument lists. Your strike universe changes overnight. Three things break in practice:
- Cached strike ladders go stale. A system that pulled the chain once and stored it is now picking strikes from yesterday's universe.
- Instrument tokens change. If your order layer maps "ATM + 2 strikes" to a stored token instead of resolving it live, you can fire into the wrong contract.
- Backtests assume strikes that did not exist. Historical option data vendors often present a full, tidy strike ladder. On a real fresh-series day, far strikes get introduced progressively as spot moves. A backtest that fills a deep OTM leg on day one of a series may be filling an instrument that was not listed yet — and definitely was not liquid.
The fix is boring and effective: resolve strikes from a live instrument master every session, and log which strikes actually had quotes at the timestamp you traded.
Expiry day rules — and the verification habit
Here is where current sources genuinely disagree, which is itself a useful lesson.
NSE's Nifty Bank F&O page states that BANKNIFTY futures contracts expire on the last Tuesday of the expiry period, and that if the last Tuesday is a trading holiday, contracts expire on the previous trading day, referencing circular NSE/FAOP/68747. Meanwhile, secondary education pages still describe Bank Nifty as expiring monthly on the last Wednesday following SEBI's October 2024 expiry rationalisation, and at least one live option chain page still labels the series as "Weekly Wednesday expiry."
Do not resolve that disagreement from a blog post — including this one. Resolve it from the exchange contract specification and the referenced circular, and then from your broker's instrument master, which is what your orders will actually hit.
The engineering rule: never hardcode an expiry weekday. Derive expiry from the instrument master, and build a holiday-shift rule that moves expiry to the previous trading day. A hardcoded weekday is the kind of bug that stays invisible for months and then fires on a holiday-shifted week with full position size.
The strategy rule: if index expiry is monthly rather than weekly, your "expiry day" sample shrinks to roughly 12 events a year. A three-year backtest gives you about 36 expiry sessions. That is a thin sample for an edge you are claiming to have found. Treat expiry-day statistics from small samples with appropriate suspicion — this is exactly the setup where overfitting looks like skill.
Build a constituent event map, not just an index calendar
Because Nifty Bank is concentrated, the index calendar is incomplete. You need a second layer.
What to track
- Policy dates. RBI policy outcomes and any liquidity or regulatory announcements affecting banks.
- Constituent results dates. Especially for the heaviest weights. Two or three names can dominate index movement.
- Asset-quality and credit data. Quarterly NPA disclosures and sector credit growth releases.
- Weight changes. Index reviews change the constituent set and the weights. Your assumption about "which bank matters" can go out of date without any price action telling you.
How to turn it into a rule
Event awareness only helps if it blocks or resizes something. Some rule shapes that survive contact with live markets:
- No new short-volatility entries in the session before a scheduled policy outcome.
- Reduced position size when a top-weight constituent reports during your intended holding window.
- A hard block on initiating new index option structures in the final minutes before a known event print.
The question to ask of any structure you hold through an event is simple: am I short gamma into a single-name catalyst that the index-level IV may already be pricing? If yes, the trade is an event bet, whatever your chart said.
This is also where index context beats isolated signals. A single bank stock setup can look clean while the broader banking tape is weak. Looking at index cards and a sector heatmap before acting on a scanner signal is a cheap filter — Anadi's Indices view exists for exactly that framing step, and the Action Center layer adds F&O eligibility, OI pulse, VWAP gate, basis and PCR context plus explicit blocked reasons like chase distance before anything reaches a trade panel.
Reading the option chain without borrowing someone else's conclusion
An option chain gives you calls on one side, puts on the other, and a handful of columns per strike: open interest, change in OI, volume, implied volatility and last traded price. The standard reading is that heavy call OI marks where writers are positioned above, heavy put OI marks where they are positioned below, and the span between the clusters sketches an implied range.
That reading is fine as positioning information. It is not a forecast. Writers reposition. Clusters move. An implied range derived from OI describes what option sellers have currently committed to, not what price is obliged to do.
Sanity checks before you trust a chain snapshot
Auto-generated chain commentary is everywhere now, and it drifts. One live option chain page for Nifty Bank currently describes OI clustering "tightly around the 32,000 strike" in the same paragraph where it quotes spot near 54,977 and an implied band running from roughly 51,500 to 57,000. Those statements cannot all be describing the same chain.
So, before any chain data becomes a strategy input:
- Plausibility check. Are the highlighted strikes anywhere near spot? A cluster thousands of points away from the band you just computed is a data or template error.
- Timestamp check. Is this live, delayed, or an end-of-day snapshot being presented as live?
- Lot size check. Third-party pages list a lot size; verify it against the exchange, because lot sizes get revised and a stale value silently misstates every risk number you compute.
- OI change sign convention. Confirm whether "OI change" is versus previous close or intraday start. The two tell different stories.
- Liquidity gate. Minimum OI, minimum volume, and a maximum bid-ask spread expressed as a percentage of premium. A strike with a beautiful Greek profile and no depth is a slippage generator.
Anadi's options workspace keeps chain rows, OI analysis, IV and theta views, basket preview and margin estimate in one place so these checks happen before execution rather than after a fill — but the discipline matters more than the tool. Log the chain yourself, at fixed timestamps, so you can later reconstruct what your system actually saw.
GEX, vanna and charm: useful lenses, not instructions
Dashboards publishing gamma exposure, vanna, charm, dealer positioning, volatility skew and IV surfaces for NIFTY, BANKNIFTY, FINNIFTY and others have become popular with Indian options traders. The structural framing is genuinely useful — it describes forces behind price movement rather than drawing lines on a chart.
Two cautions.
First, read the disclaimers. One such dashboard states plainly that it publishes automated, algorithm-generated commentary for educational purposes, is operated in a personal capacity, and is not registered with SEBI, AMFI, NSE or BSE in any capacity. That is not a knock on the site — it is an accurate description of what you are consuming.
Second, and more practically: you cannot backtest a number you cannot reproduce. If a GEX figure comes from someone else's model with undisclosed assumptions, you can use it as context, but you cannot honestly include it as a rule in a validated system. Either reproduce the computation from chain data you log yourself, or keep it in the "context I read" bucket, separate from the "rules my algo executes" bucket.
Keeping those two buckets separate is probably the single highest-value habit in discretionary-plus-algo workflows.
Turning all of this into system rules
Context is only worth the rules it produces. Candidate filters, each testable:
- Regime gate. Define a volatility band using IV rank or India VIX, and specify which strategies are permitted in which band.
- Event block. Named-date blocks for policy outcomes and top-weight constituent results.
- Expiry proximity throttle. Smaller size or wider invalidation in the final sessions of the series, where gamma behaviour changes.
- Fresh-series handling. On the trading day after near-month expiry, re-pull the instrument master before any strike selection.
- Chase distance. Skip entries beyond a defined distance from the trigger level.
- Basket-level stop. Multi-leg structures need a combined stop, not four independent leg stops that can leave you naked.
Build these in a BANKNIFTY strategy builder as explicit, named conditions rather than as things you remember to do. Then separate your backtest results into expiry-week and non-expiry-week buckets and compare them honestly. If the edge lives entirely in a 36-session expiry sample, you have a hypothesis, not a strategy.
And size the whole thing through a defined risk management layer — daily loss limit, per-strategy capital cap, max concurrent positions. Concentration risk at the index level deserves a concentration limit at the portfolio level.
If you want to test this kind of workflow — scanner to chain to basket to margin to risk, with the contract layer resolved live rather than hardcoded — you can request early access and run it in paper mode first.
Weekly checklist for Nifty Bank F&O workflows
- Verify expiry day and holiday shift from the exchange contract spec and your broker's instrument master, not from a cached constant.
- Re-pull strikes after every near-month expiry, since new strikes are introduced the following trading day.
- Confirm current lot size and contract cycle before computing any margin or risk number.
- Maintain a constituent event calendar: policy dates, heavyweight results, asset-quality disclosures.
- Check index and sector context before acting on individual signals.
- Run plausibility, timestamp and liquidity checks on every chain snapshot that feeds a rule.
- Keep third-party analytics in the context bucket unless you can reproduce the computation.
- Report expiry-week and non-expiry-week performance separately, and state the sample size.
- Define basket-level stops for multi-leg structures before entry.
None of this predicts where Bank Nifty goes. That is the point. The contract mechanics, the concentration profile and the data hygiene are the parts you can actually control — and they are usually the parts that decide whether a working strategy survives the week it meets a holiday-shifted expiry.