A new category of free tool has quietly become popular with Indian index traders: the options flow dashboard. One such site, OptionsFlow, publishes live Gamma Exposure (GEX), Vanna exposure, Charm exposure, volatility skew, PCR and an implied volatility surface for NIFTY, BankNIFTY, Sensex, FinNIFTY and Midcap Nifty — all built from NSE and BSE option chain data, and described by its own operators as "automated, algorithm-generated options market structure commentary" for educational purposes, run in a personal capacity and not registered with SEBI, NSE or BSE in any capacity.
That combination — institutional-sounding Greek aggregates, retail accessibility, zero regulatory standing — is exactly why this deserves a process discussion rather than an excited one.
This post is not about whether gamma dashboards "work." It's about what they actually measure, where their inputs break, and how an algo trader can convert that information into risk filters and expiry-week preparation instead of directional conviction.
What a GEX dashboard is actually computing
Start with what the exchange publishes. A live option chain gives you, per strike: open interest, change in OI, volume, implied volatility, and last traded price. Source 4's column guide for the NIFTY Bank chain lists exactly those fields.
Notice what is missing: who is long and who is short that strike.
Every dealer-gamma number you see on a flow dashboard has to assume the answer. The usual convention is that market makers are short the options retail buys and long the options retail sells, so OI at each strike gets a sign, multiplied by gamma, summed across strikes, and presented as "dealer positioning." The maths is real. The sign convention is an assumption layered on public OI.
The same applies to the other Greeks on those dashboards:
- GEX (gamma exposure) — estimated hedging sensitivity to spot moves. Large concentrations are read as areas where hedging flow may dampen or amplify movement.
- VEX (Vanna) — how delta exposure shifts when IV changes. Matters most when India VIX moves sharply alongside spot.
- CEX (Charm) — how delta decays as time passes. Mechanically largest on expiry day, which is why expiry sessions behave differently from Monday sessions.
- Skew and the IV surface — the relative pricing of puts versus calls across strikes, which tells you what the market is charging for protection.
None of these are predictions. They are descriptions of sensitivity. A high absolute GEX reading does not say price will go anywhere. It says the mechanical response to a move may be different from a low-GEX day. For an algo trader, that is a statement about expected slippage, stop behaviour and realised volatility — which is a risk input, not an entry signal.
The October 2026 expiry-week context, and a data-hygiene warning
Here is a live example of why you validate before you automate.
On 20 October 2026, one option chain aggregator (Strota) reported BANKNIFTY PCR at 0.96 for the nearest expiry of 27 October 2026, with max pain at 55,600 — explicitly computed from the NSE F&O bhavcopy of 19 October. Another aggregator (MarketNetra) labelled NIFTY Bank as "Weekly Wednesday expiry" with lot size 15, and in the same auto-generated paragraph claimed call OI peaks at the "32,000-point strike" while describing an implied range of roughly 53,000 to 56,000.
Three problems jump out, and all three are the kind that quietly corrupt an algo:
- "Live" sometimes means yesterday. Max pain and PCR built from the previous day's bhavcopy are EOD-derived, even on a page that refreshes every minute. If your rule uses max pain as an intraday input, you may be acting on data that is eighteen hours old.
- Two sources disagree on the expiry day itself. One implies a Tuesday 27 October expiry, the other says weekly Wednesday. NSE's own BankNIFTY page states futures expire on the last Tuesday of the expiry period (falling back to the previous trading day on a holiday) and points to circular NSE/FAOP/68747 for detail. Expiry day and contract specs are circular-driven and have changed more than once. Your calendar must come from the exchange, not a dashboard footer.
- Auto-generated commentary contains obvious internal contradictions. A strike of 32,000 inside a 53,000–56,000 range is not a judgement call; it's a broken field. If a generator can publish that, it can publish a wrong OI number that looks plausible.
Nothing here means the tools are useless. It means the data layer is the weakest link, and it sits upstream of every rule you build.
Three validation checks before any external feed touches a strategy
- Timestamp check. For every field, know whether it is tick-live, minute-delayed, or bhavcopy-derived. Tag it in your own log. A single
data_asofcolumn has saved more strategies than any indicator. - Cross-source check. Compare one number — ATM IV, total call OI, spot — against the exchange or your broker API feed. If the gap exceeds a threshold you set in advance, the rule goes to no-trade, not to best-guess.
- Sanity-bound check. Reject values outside plausible bounds: strikes far from spot, IV above a hard ceiling, PCR of zero, OI that collapses to a fraction of the prior snapshot. Scrapers fail loudly on a bad day and silently on a worse one.
Multi-index expiry weeks changed the risk, not just the calendar
The OptionsFlow dashboard covers five underlyings across two exchanges — NIFTY, BankNIFTY, FinNIFTY and Midcap Nifty on NSE, and Sensex on BSE. That's the real structural story for Indian options traders: expiry pressure is now spread across the week and across exchanges rather than concentrated in one session.
For process, this matters in three concrete ways.
Your "expiry day" flag is no longer a single boolean. A strategy on BankNIFTY can be trading on a day that is expiry for a different index. Charm and gamma effects on that index's chain can still move the broader tape through correlated banking and financial names. If your strategy builder rules only know their own instrument's expiry, they are blind to the day's actual character.
Correlated indices are not independent bets. BankNIFTY concentrates in a dozen banking stocks and FinNIFTY overlaps heavily with it. Running "diversified" index strategies across both, each with its own position limit, can produce a portfolio far more concentrated than the per-strategy numbers suggest. Basket-level and portfolio-level limits are the only honest way to see this.
Monthly and weekly cycles stack. NSE introduces fresh strikes for new contracts on the trading day following near-month expiry, so chain depth, liquidity and quoted spreads at far strikes are not uniform through the month. A strike-selection rule that works mid-series may pick an illiquid leg on a fresh series day.
Turning flow context into filters, not forecasts
The useful question is not "what does GEX say about direction." It is "what should this reading change about my sizing, my stop, and whether I trade at all." Treat each dashboard reading as an input to one of three filter types.
Volatility regime filter
Skew and the IV surface tell you what protection costs relative to upside. For a premium-selling system, a flattening skew with compressed IV changes the entire payoff profile — the same strike distance that produced a comfortable credit last month may now produce a credit that does not pay for the tail risk. Rather than a view, encode a state: if ATM IV and IV rank fall below your floor, the short-premium variant stands down and the hedged or debit variant is eligible. Our note on options backtesting covers why these regime states need to exist in the test, not just in live trading.
Expiry-day gamma and Charm filter
Charm is mechanically largest on expiry day, which is the quantitative version of what every retail options trader already feels: positions that behaved predictably on Monday behave violently on expiry afternoon. Practical encodings — not predictions:
- Cut per-trade size on expiry sessions by a fixed, pre-decided factor.
- Widen or convert stops, because a tick-based stop in a high-gamma tape converts into slippage rather than protection.
- Set a hard cutoff time after which new entries stop and only exits are allowed.
- Avoid deep-OTM legs whose delta can change character within minutes.
Event and liquidity avoidance filter
High absolute GEX plus a thin participation day is a different animal from high GEX on a broad-participation day. Use index and sector breadth as context before acting on any single setup — a strong-looking setup in a weak sector tape is a different trade from the same setup with sector confirmation. This is the same discipline we describe in the weekly market outlook: context sets the risk budget, it does not generate the entry.
What this looks like inside a workflow
The failure mode with flow dashboards is tab-hopping. Trader sees elevated GEX on one site, pulls the chain on a second, guesses at margin, and fires an order from a third — with no record of what the inputs were.
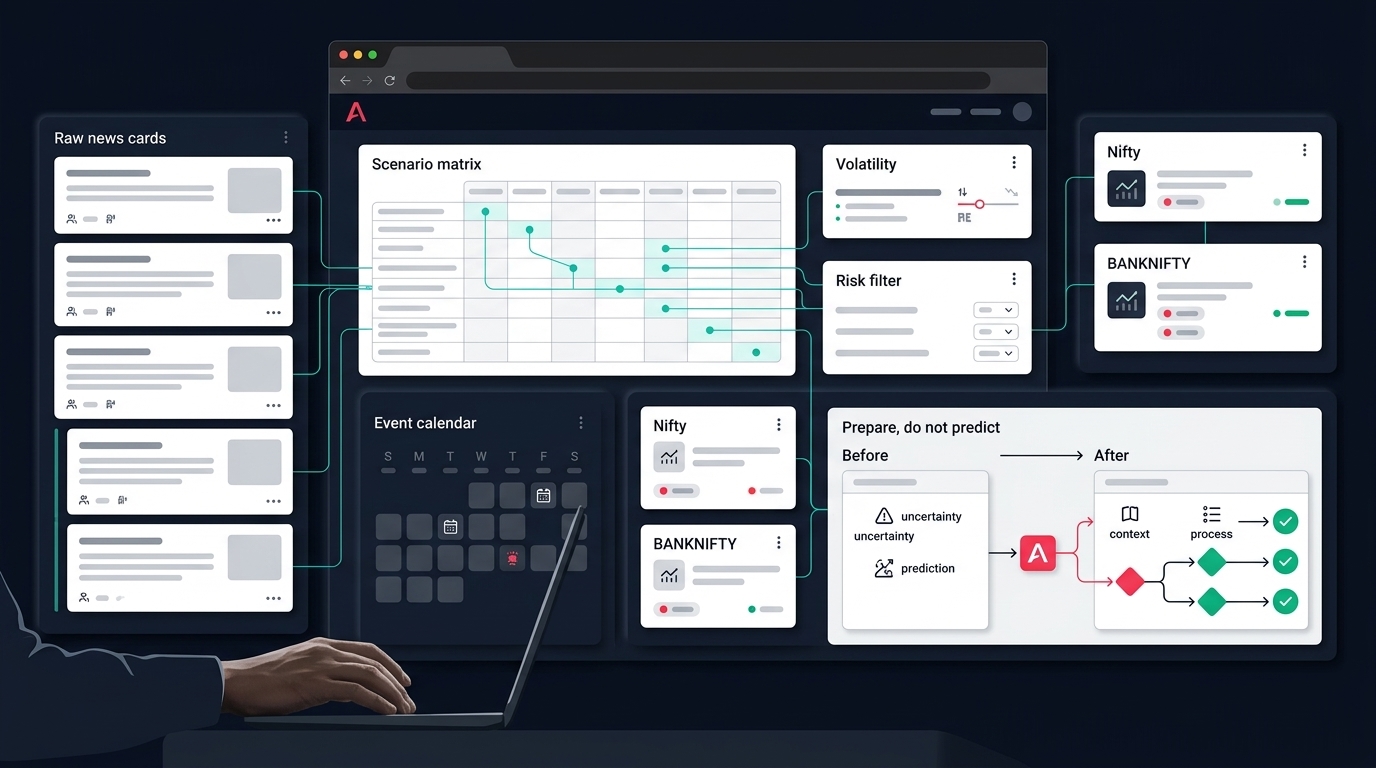
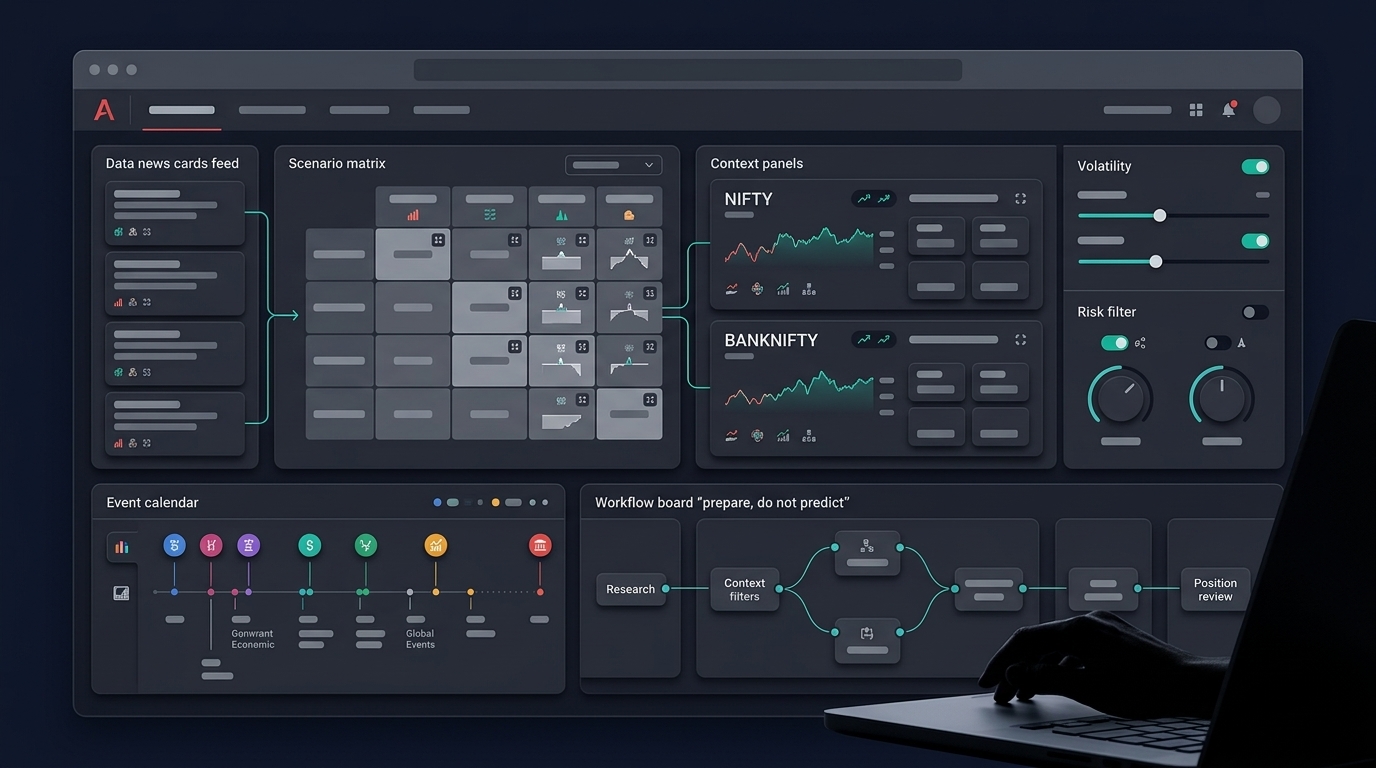
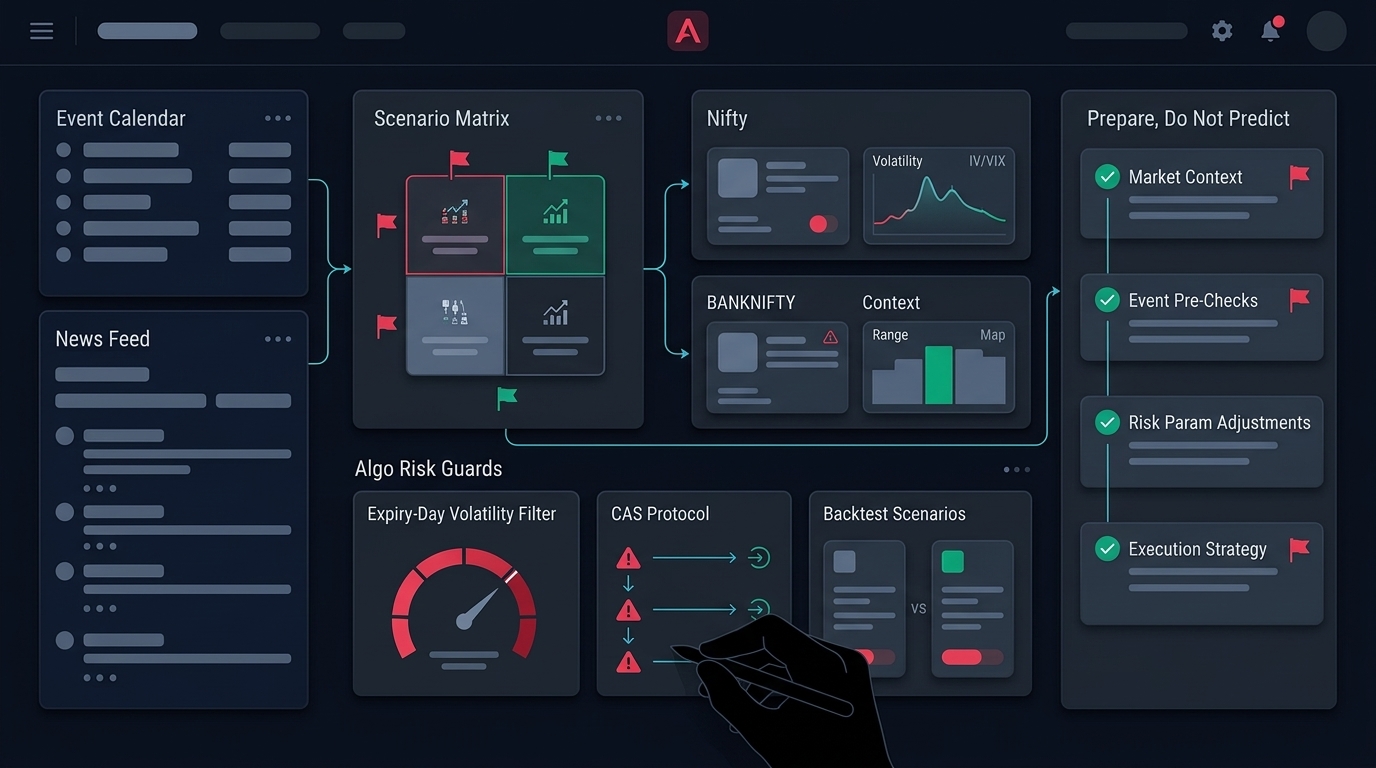
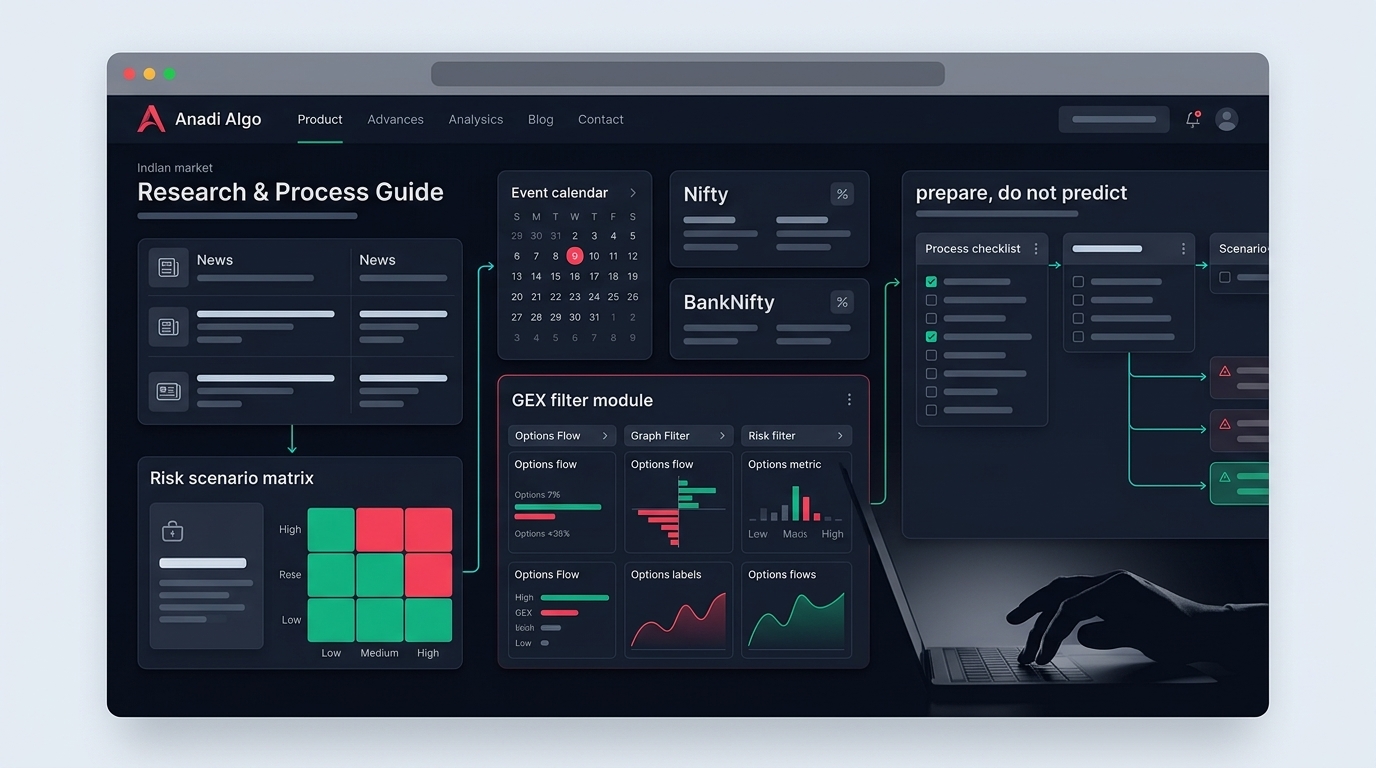
Inside Anadi's options workspace, the same sequence stays in one place: market view, then the option chain, then OI analysis, then IV and theta, then a basket preview with a margin estimate that accounts for existing positions, then a risk check before anything reaches the broker. The point isn't the number of tabs — it's that the margin and risk cards appear before execution, and the inputs behind the decision are captured.
The review half matters just as much. If you add a gamma or skew filter, you need to see what it did to the distribution, not just the headline P&L. Equity curve, P&L bucket distribution, time-of-day analysis, calendar heatmap and strategy comparison over a 3M or 6M window will tell you whether the filter cut tail losses or just cut trades. A filter that improves average P&L while deepening drawdown has not helped you, and a single summary number will hide that.
If you're building these states into rules, the BANKNIFTY strategy builder and risk management workflows are where the expiry flags, basket stops and daily loss limits actually live. You can get early access here if you want to test the filter-then-execute sequence on your own strategies in paper mode first.
Checklist: using flow dashboards without getting used by them
- Know who publishes the data and their regulatory standing. OptionsFlow states it is operated personally and is not registered with SEBI, AMFI, NSE or BSE in any capacity — read that as a reason to verify, not as a disqualification.
- Treat algorithm-generated commentary as unaudited text. Check it against the chain itself.
- Log
data_asoffor every external field. Bhavcopy-derived is not live. - Source expiry days, lot sizes and contract specs from exchange circulars, and re-verify each series.
- Make your expiry flag multi-index and multi-exchange, covering NIFTY, BankNIFTY, FinNIFTY, Midcap and Sensex cycles.
- Cap exposure at basket and portfolio level, because BankNIFTY and FinNIFTY overlap.
- Convert GEX, Vanna and Charm readings into sizing, stop-style and cutoff-time rules, never into direction.
- Backtest the filter as a state variable and judge it on drawdown and distribution, not on total P&L.
- Define the no-trade state explicitly: stale data, cross-source mismatch, failed sanity bounds.
Gamma dashboards describe how the market may respond to a move. They don't know whether the move is coming. Keep them on the risk side of your system and they'll earn their place; promote them to a signal generator and you've only added a new, more sophisticated way to be confidently wrong.