Open interest (OI) gets treated like a crystal ball on Indian Twitter. Big call OI at 25,000? Resistance. Big put OI at 24,500? Support. Trade accordingly.
If only it were that clean.
OI tells you where contracts are sitting, not where price is going. It is a context layer — useful when combined with price action, volume, and expiry timing, dangerous when read in isolation. This post walks through how to use OI buildup analysis as part of a scanner workflow without chasing every spike.
What OI buildup actually means
Open interest is the count of outstanding option contracts at a strike that haven't been squared off or exercised. A "buildup" is a meaningful change in OI within a session or over a few sessions.
There are four buildup states traders commonly track:
- Long buildup: Price up, OI up — fresh longs entering.
- Short buildup: Price down, OI up — fresh shorts entering.
- Long unwinding: Price down, OI down — longs exiting.
- Short covering: Price up, OI down — shorts exiting.
The price-plus-OI combination is what gives the signal meaning. OI change alone tells you activity is happening, not who is winning.
Why OI is context, not a call
Three reasons retail traders get burned reading OI as a direct signal:
1. OI is seller-skewed. Most option OI in India is built by institutional sellers — prop desks, market makers, large traders. When call OI builds at 25,000, it often means sellers are confident the index won't cross. But "confident" is not "correct." A strong move can blow through these levels and trigger short covering, which then accelerates the move.
2. Expiry distortions are real. As expiry approaches, OI shifts driven by rollover, hedging, and unwinding muddy the picture. The same OI pattern means very different things on a Monday versus a Thursday afternoon.
3. Strike-level OI can mislead at the index level. Heavy put OI at 24,500 doesn't mean 24,500 is a "support floor." It means a lot of contracts are open there. If those puts are hedges for a portfolio rather than directional bets, the floor narrative breaks.
Treat OI as one input in a checklist. Not the checklist.
A scanner-friendly OI workflow
Here is a workflow that turns OI buildup into a watchlist, not a trade trigger:
Step 1: Define the buildup filter
Pick concrete thresholds before the market opens. For example:
- Change in OI greater than 25% from previous day close at a strike.
- Volume at the strike above its 5-day average.
- Underlying price action confirming the buildup direction.
Without thresholds, every flicker looks like a setup.
Step 2: Pair OI with price structure
A short buildup in calls at 25,000 only matters if Nifty is trading in a range where 25,000 acts as a real ceiling. If the index is at 24,200 and grinding lower, the 25,000 call OI is noise for today.
Pull a simple price-action filter:
- Is the underlying in a range or a trend?
- Where are the recent intraday highs and lows?
- Is the OI buildup at a level price is actually testing?
Only strikes that are within a tradable distance of spot deserve attention.
Step 3: Cross-check with PCR and VIX
Put-call ratio (PCR) and India VIX add useful context:
- A PCR drifting up while put OI builds at a strike suggests sellers see that strike as a real floor.
- A VIX spike during a short buildup usually means the buildup will not hold quietly — option premiums are pricing in movement.
These are not magic numbers. They are sanity checks.
Step 4: Validate before automating
This is where most retail traders skip a step. They see a clean OI setup, place a trade, and learn the hard way that "clean on the chart" is not the same as "edges out in backtest."
Before turning an OI-based idea into an automated rule, run it through proper options backtesting across at least 12-18 months of data, with a mix of trending and ranging regimes. Check:
- Hit rate on buildup-driven entries.
- Average loss when the buildup fails.
- Behavior on expiry day versus other days.
- Slippage assumptions on the strikes you actually traded.
If the backtest shows the edge only exists on three months of bull data, you don't have an edge — you have a fitted curve.
Practical filters that reduce noise
Some filters retail traders can layer onto OI-based watchlists to cut down on false positives:
- Liquidity floor: ignore strikes with bid-ask spreads wider than a defined paisa threshold for your underlying.
- Time-of-day filter: the first 15 minutes of OI change are often noisy due to overnight unwinding. Many traders prefer to wait for a 9:30 or 9:45 baseline.
- Day-of-week filter: separate Thursday/expiry behavior from rest-of-week behavior in your rules.
- Event filter: skip OI signals on RBI policy days, Fed days, or major earnings if your underlying is sensitive to them.
A good stock scanner lets you encode these conditions, save them as a saved view, and run them every morning rather than rebuilding the logic from scratch.
A simple OI checklist before any trade
Before acting on an OI buildup setup, walk through this:
- Is the buildup confirmed by underlying price action in the same direction?
- Is the strike within a realistic distance of spot today?
- Does PCR or VIX agree, or at least not contradict?
- Is it expiry week, and have I adjusted for rollover noise?
- Has this exact rule been backtested across regimes, not just last month?
- Do I have a defined invalidation level — where does this idea fail?
If you cannot tick all six, you have a hypothesis, not a trade.
Where Anadi Algo fits
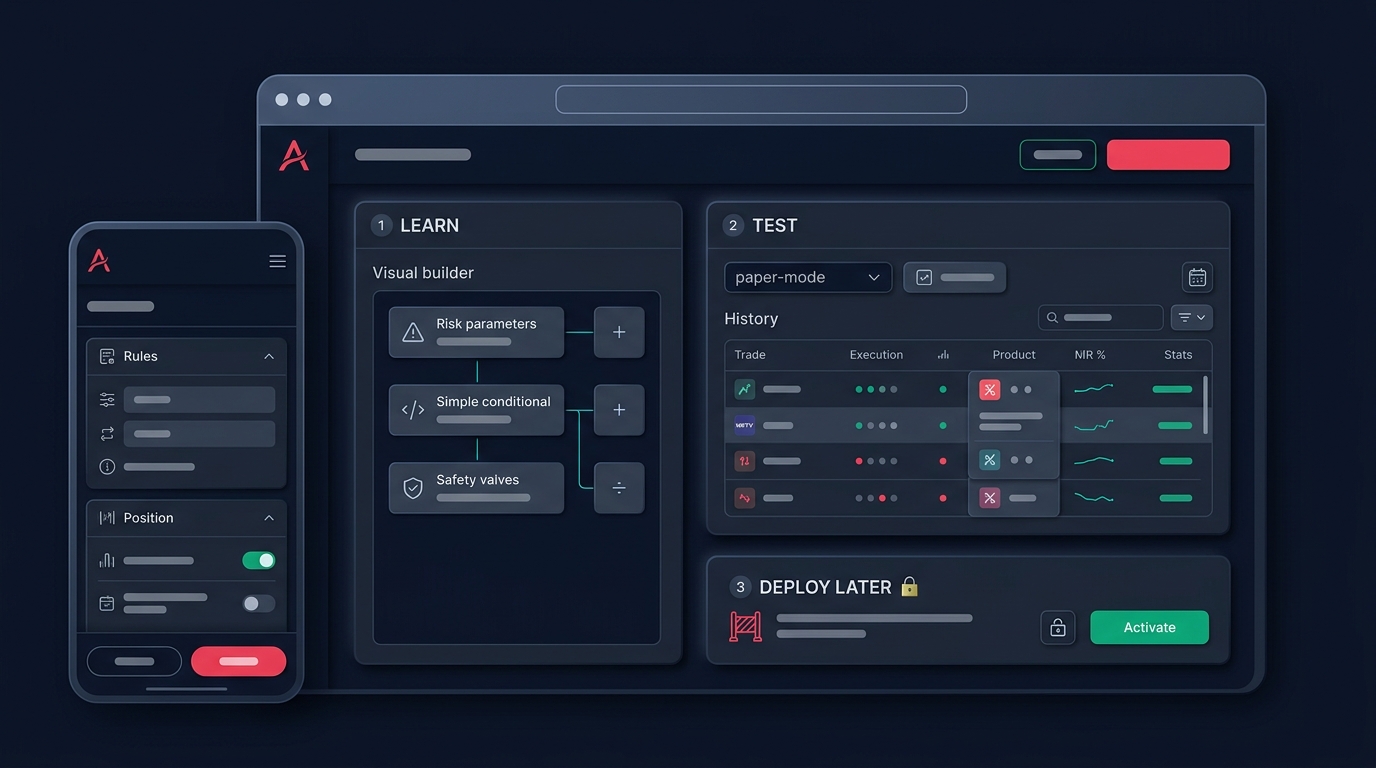
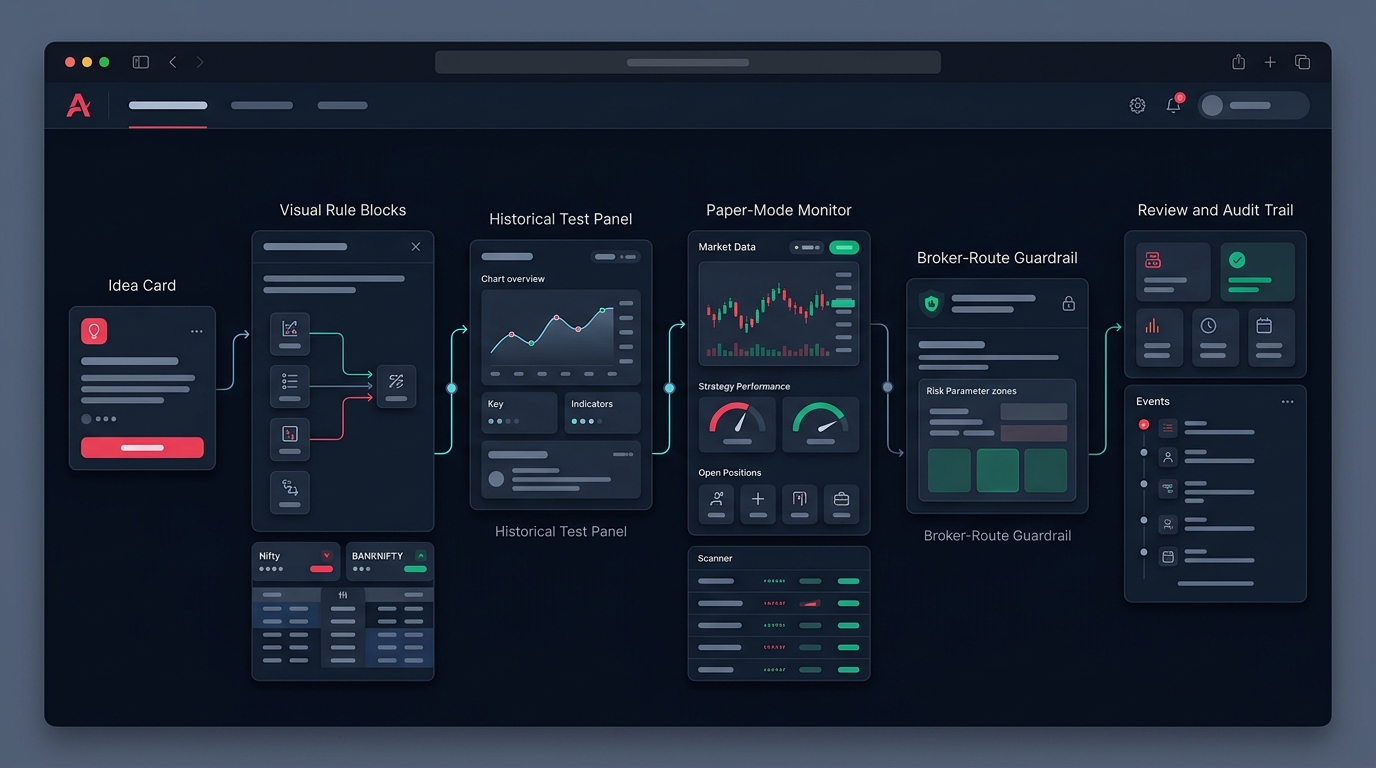
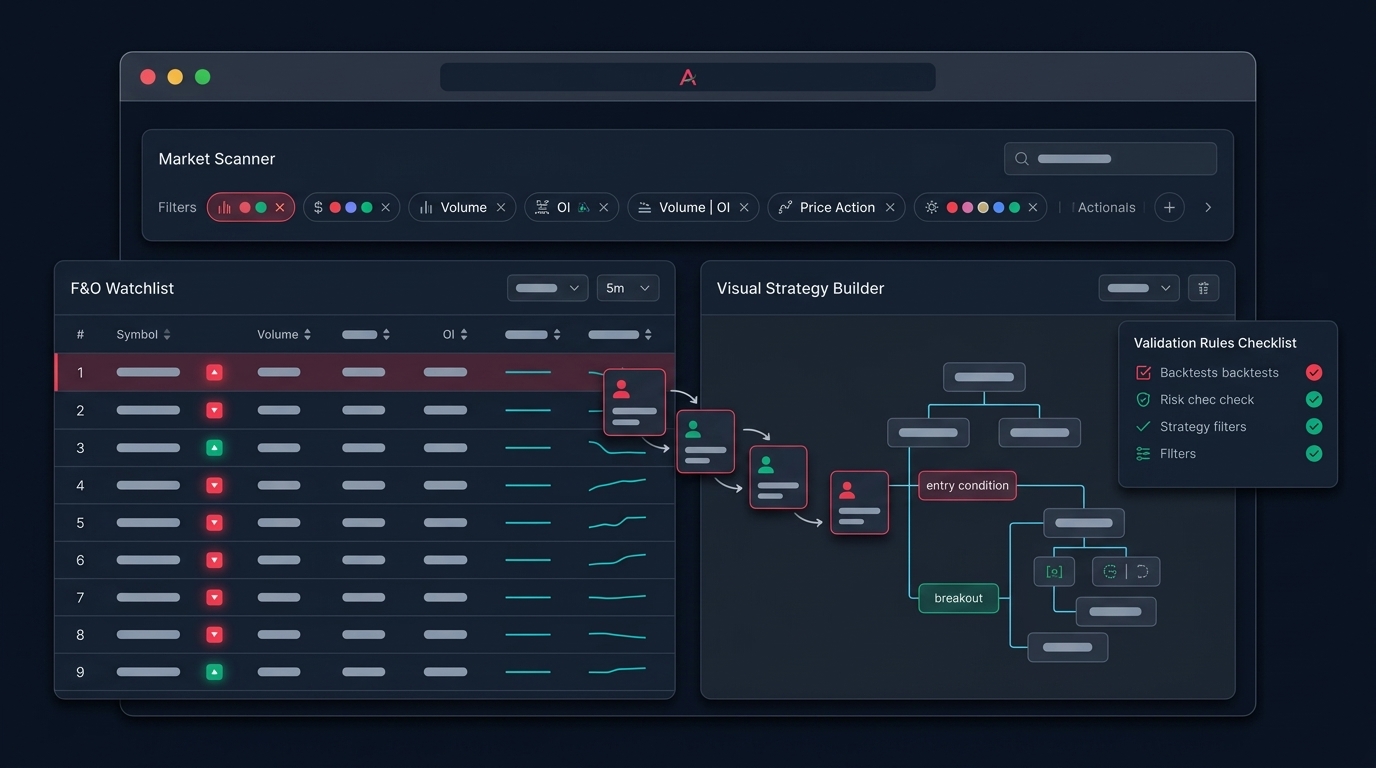
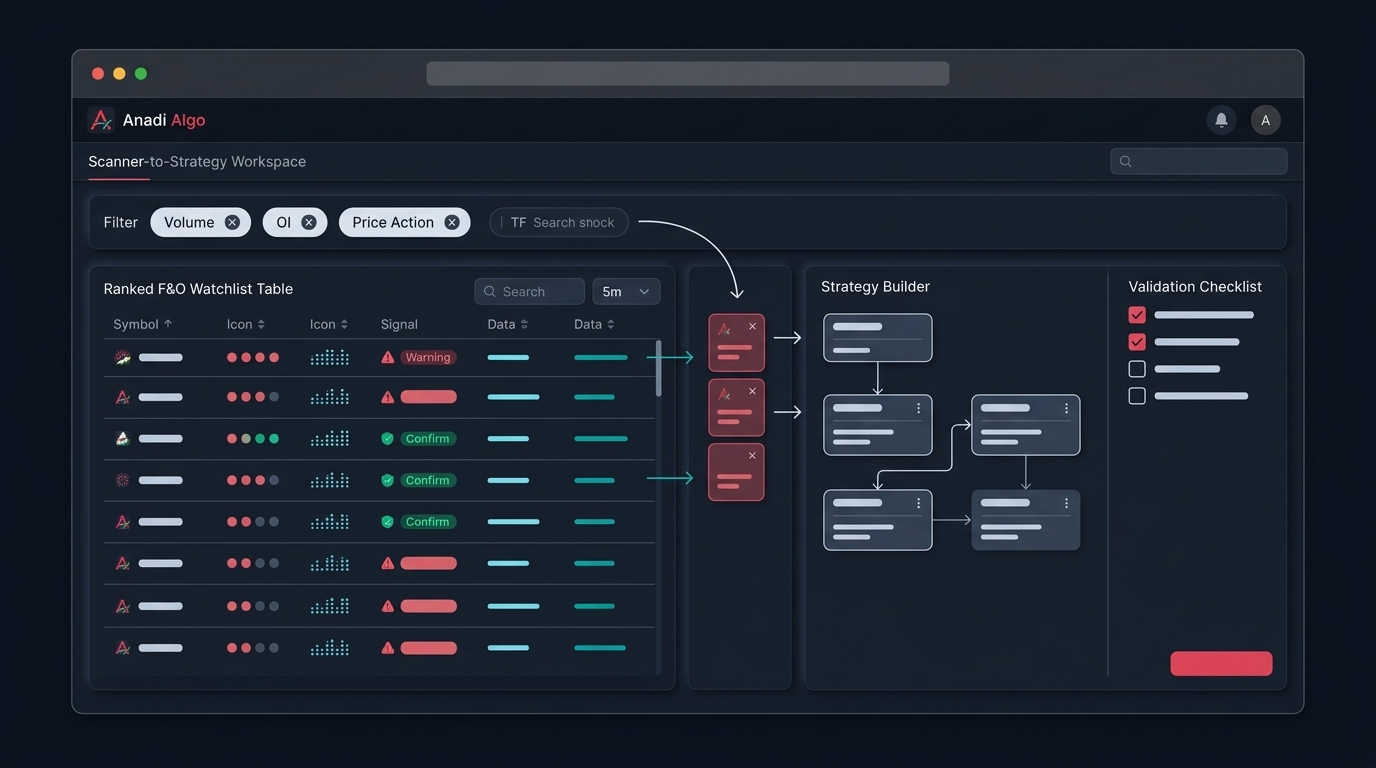
OI buildup analysis works best when the workflow from scanner to signal to execution is connected. The Anadi Algo scanner can encode OI thresholds with price and volume filters, push qualifying strikes to a watchlist, and feed them into a strategy with defined entry, exit, and risk rules. From there, backtesting validates the rule before it goes live, and execution is handled by your linked broker.
You can try the workflow with early access if you want to test an OI-based setup end-to-end before committing capital.
Takeaway
OI buildup is one of the most over-interpreted data points in Indian options trading. Used as context — alongside price action, volatility, expiry timing, and a backtested rule — it can sharpen a watchlist. Used as a standalone signal, it is just another way to chase noise and feed slippage to the people on the other side of the trade.
Read OI to understand where positioning sits. Trade on a rule that has been tested.