Most BANKNIFTY intraday backtests get read wrong. A trader runs six months of data, sees a green total P&L, and decides the system "works." That single number hides everything that actually decides whether you can trade the strategy with real money.
BANKNIFTY is fast. It swings harder than NIFTY, spreads widen when it moves, and an intraday system fires many trades. So the order in which you read your backtest metrics matters. If you look at total profit first, you'll fool yourself. Look at survival first, profit last.
Here's the order that keeps you honest.
Read drawdown before you read returns
Total P&L tells you the destination. Drawdown tells you the road. And the road is where accounts blow up.
Measure three things:
- Max drawdown — the largest peak-to-trough fall in your equity curve. This is the worst stretch the strategy put you through, not the worst you imagine.
- Drawdown duration — how many trading days you stayed underwater before making a new high. A 15% drawdown that recovers in a week is very different from one that drags for two months.
- Drawdown vs capital — a strategy that shows a 40% drawdown on the test capital is not "aggressive," it's a size problem waiting to happen.
The honest question is not "how much did it make?" It's "could I sit through the worst patch without switching it off?" Most traders abandon a system right at the bottom of a drawdown — which is exactly when a real edge is about to recover. If you don't know the drawdown shape in advance, you'll quit at the wrong time.
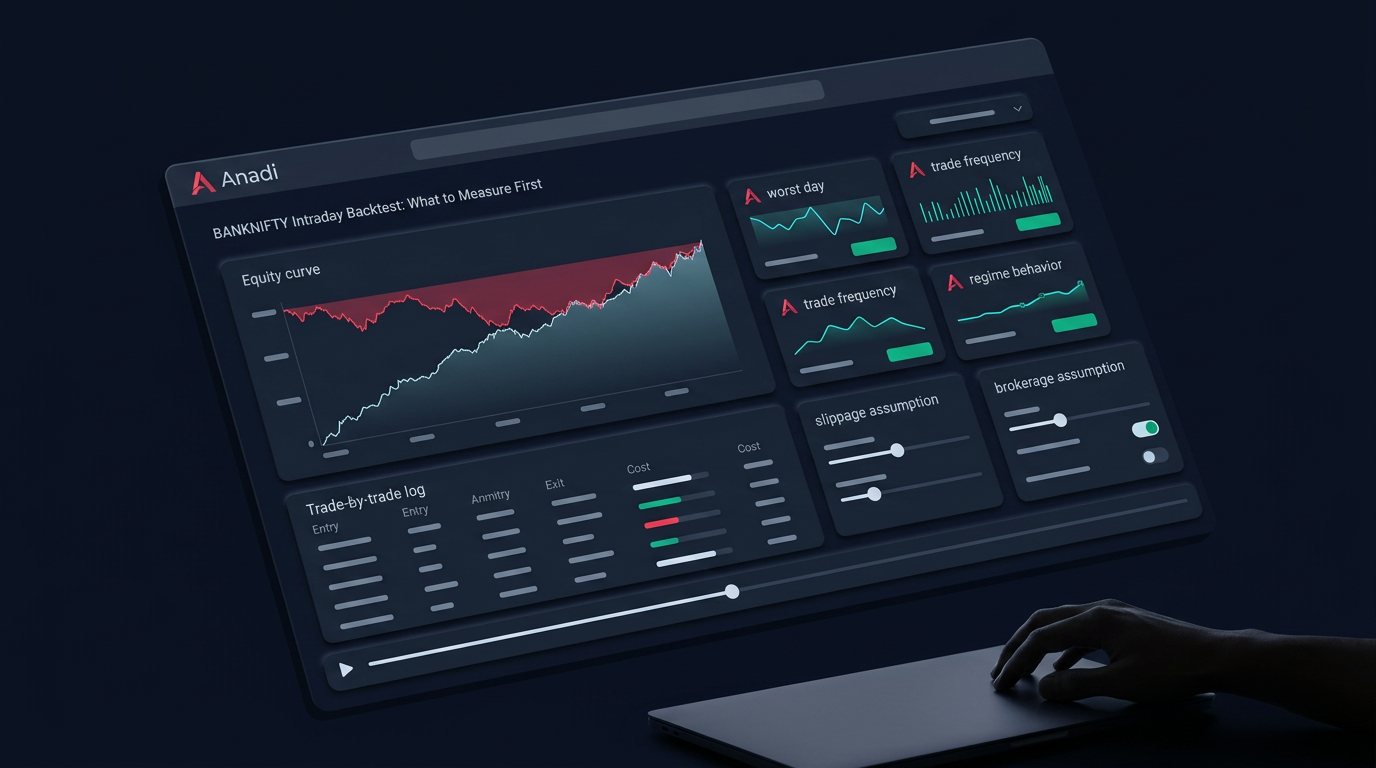
An equity curve makes this obvious. A smooth upward line and a jagged line can end at the same P&L, but only one is tradeable. This is why reviewing the curve and the drawdown band matters more than the headline number — the same reason analytics dashboards put the equity curve front and centre instead of a single figure.
Your worst day sets your position size
After overall drawdown, find your single worst day. Not the average loss — the ugliest one.
For BANKNIFTY intraday, the worst day usually isn't a slow bleed. It's a sharp trend day that runs against a mean-reversion system, or a violent reversal that stops out a trend system twice. One bad session can wipe out a week of gains.
Ask three questions about that worst day:
- What was the loss as a percentage of capital?
- Would a daily loss limit have cut it earlier, and what does the backtest look like with that limit applied?
- Was it a one-off, or do the second- and third-worst days look similar?
If your three worst days are all clustered around the same market condition (say, high-volatility trend days), that's not bad luck — it's a structural weakness you can plan for. Your position size should be built to survive the worst day comfortably, not the average day. Size for the tail, not the middle.
Trade frequency changes the whole picture
Trade count is the metric traders skip, and it quietly decides everything else.
Costs scale with frequency. BANKNIFTY intraday systems can fire many trades a day. Each one pays brokerage, exchange charges, GST, STT, and — the big one — slippage. A strategy showing a small per-trade edge can turn negative once you multiply real costs across hundreds of trades. Always run the backtest with realistic fees and a fill model, not zero-cost assumptions.
Sample size decides trust. Ten profitable trades prove nothing. As a rough guide, you want enough trades across enough different market conditions before the results mean anything — a common view is that a full year of an intraday system should produce several hundred trades so you've seen it work across trends, ranges, and shocks, not just one friendly month.
Frequency and slippage interact. BANKNIFTY option spreads widen exactly when the index moves fast — which is often when your signals fire. If your backtest fills at the mid or the last traded price, you're overstating results. Test with a conservative fill assumption and see if the edge survives.
Here's a simple frame for reading these together:
| Metric | Weak sign | Reason it matters |
|---|---|---|
| Max drawdown | Deep and slow to recover | Decides if you can stay in the system |
| Worst day | Larger than a week of gains | Decides your position size |
| Trade count | Too few, or all in one regime | Decides if results are real |
| Cost drag | Edge disappears after fees | Decides if it's tradeable at all |
Test whether it survives different regimes
A BANKNIFTY intraday strategy almost never behaves the same in every market. The mistake is testing one clean six-month window and assuming the future looks like it.
Break your backtest period into regimes and check each separately:
- Trending vs choppy — did the system make its money only in strong directional stretches, or does it hold up in sideways weeks too?
- High vs low volatility — split by a volatility gauge like India VIX. A system that shines in high-VIX months may bleed in calm ones, and vice versa. Knowing which regime you're built for tells you when to reduce size or stand aside.
- Expiry vs non-expiry days — BANKNIFTY behaves differently as expiry approaches. If most of your profit comes from a couple of expiry sessions, that's a concentration risk, not a general edge.
The goal isn't a strategy that wins everywhere — that usually means it's overfit. The goal is knowing exactly where it works and where it doesn't, so you're not surprised in live trading.
When you run this in a structured backtest setup, keep the signal rules, timeframe, universe, fees, and risk controls explicit. Vague inputs give you vague confidence. If you build the logic in a BANKNIFTY strategy builder first, the exact rules carry cleanly into the test — so what you measure is what you'll actually trade, not an approximation.
Watch these two traps
Curve-fitting. If you tuned parameters until the backtest looked perfect, you didn't find an edge — you found the past. Reserve some data the strategy never saw and check it there.
In-sample dazzle. A stunning equity curve on the exact window you optimised on tells you almost nothing. Real confidence comes from out-of-sample and forward testing, then paper trading, before any live capital.
If you want a clean workflow to build, test, and review BANKNIFTY intraday systems with explicit costs and risk rules, you can get early access and run your own numbers instead of trusting a screenshot.
The measure-first checklist
Before you trust any BANKNIFTY intraday backtest, confirm you've looked at:
- Max drawdown and how long it lasts — can you sit through it?
- The single worst day — does it fit your position size?
- Trade count — enough trades, across enough conditions, to mean anything?
- Realistic costs and slippage — does the edge survive fees and conservative fills?
- Regime split — trending, choppy, high-VIX, low-VIX, expiry vs non-expiry.
- Out-of-sample and paper results — did it hold up on data it never saw?
Read them in that order. Total P&L is the last box you tick, not the first. A backtest that survives drawdown, worst day, frequency, costs, and regime testing is worth trading. One that only shows a big green number is just a nice-looking guess.