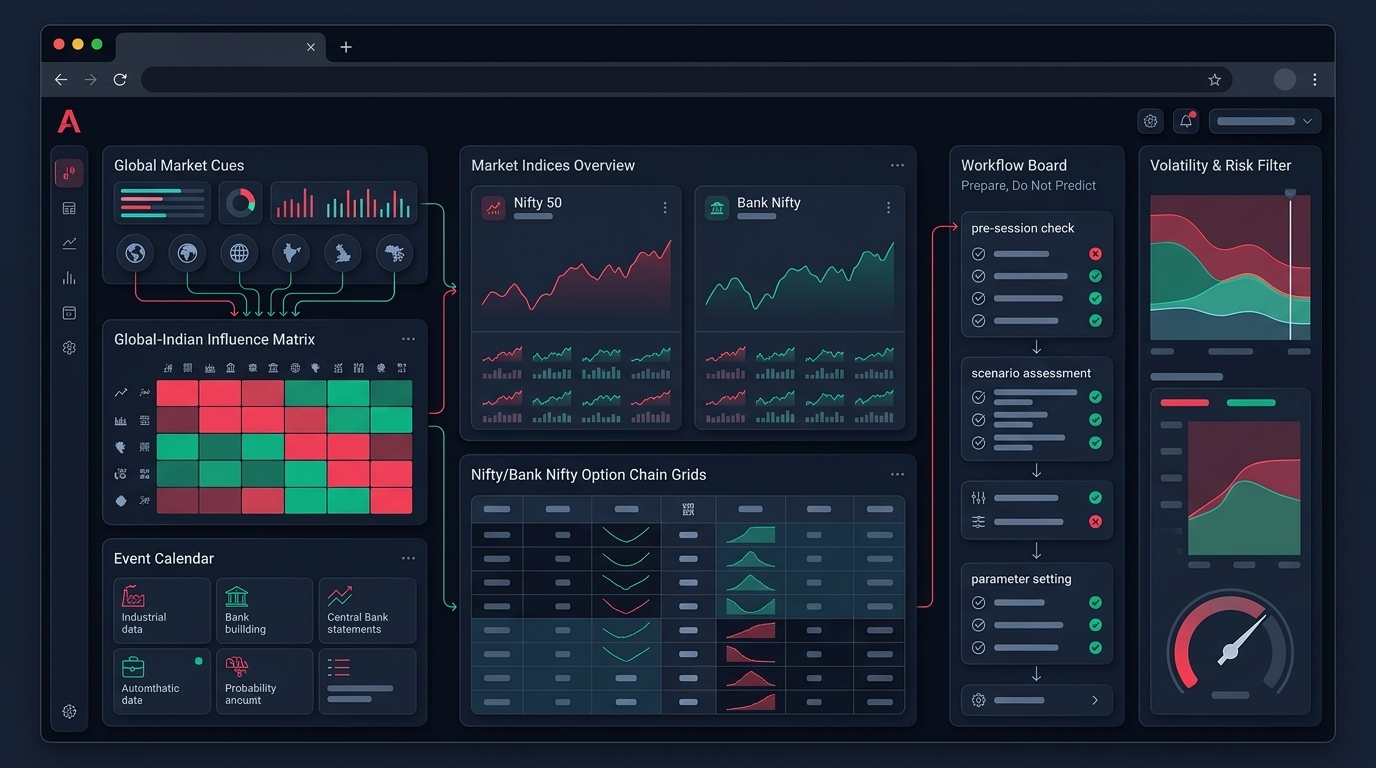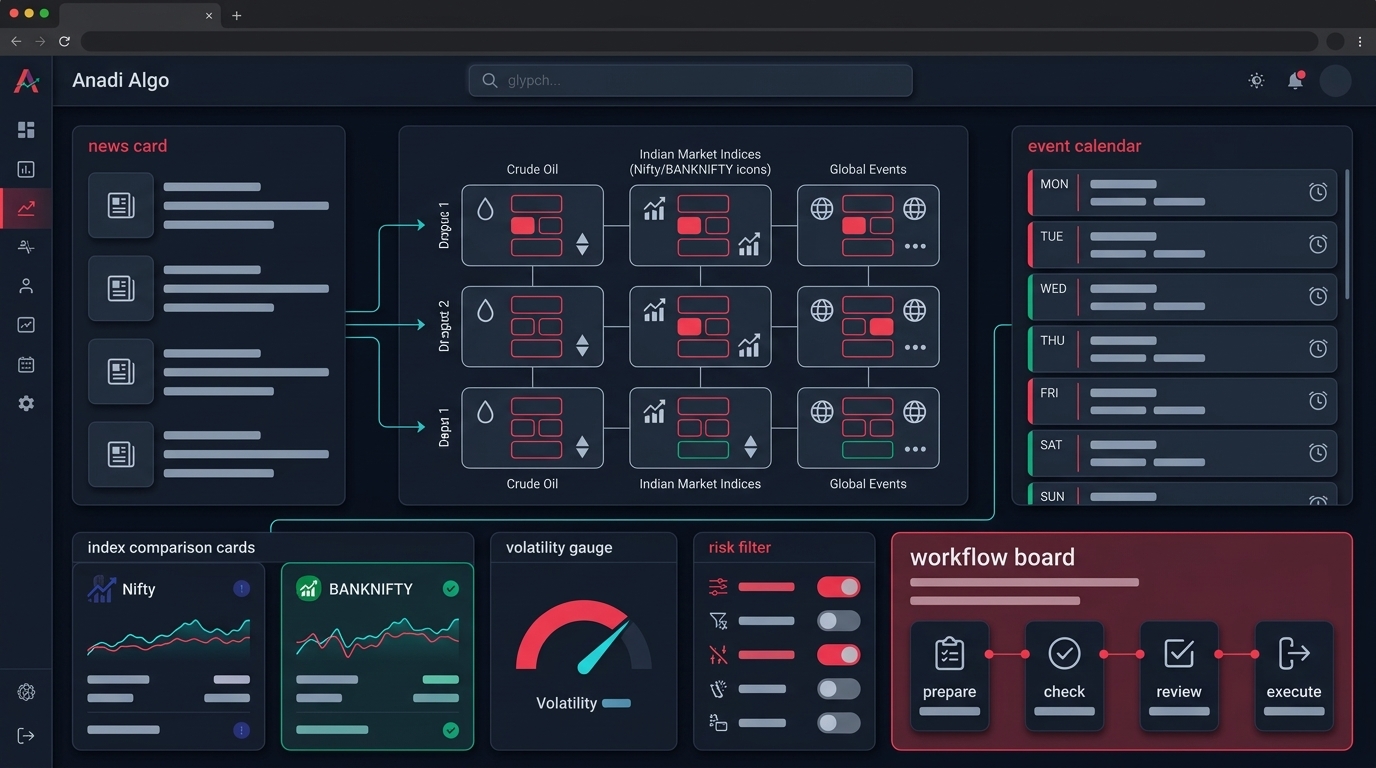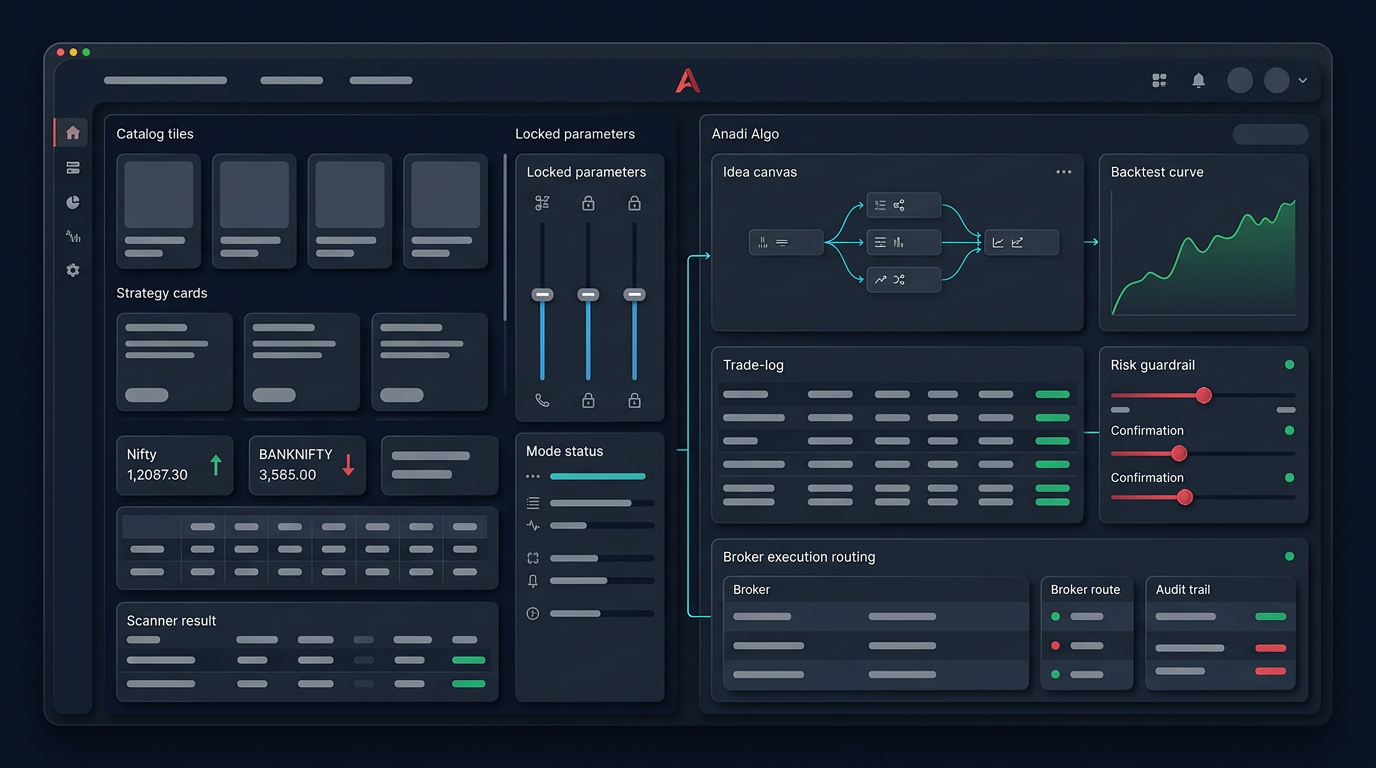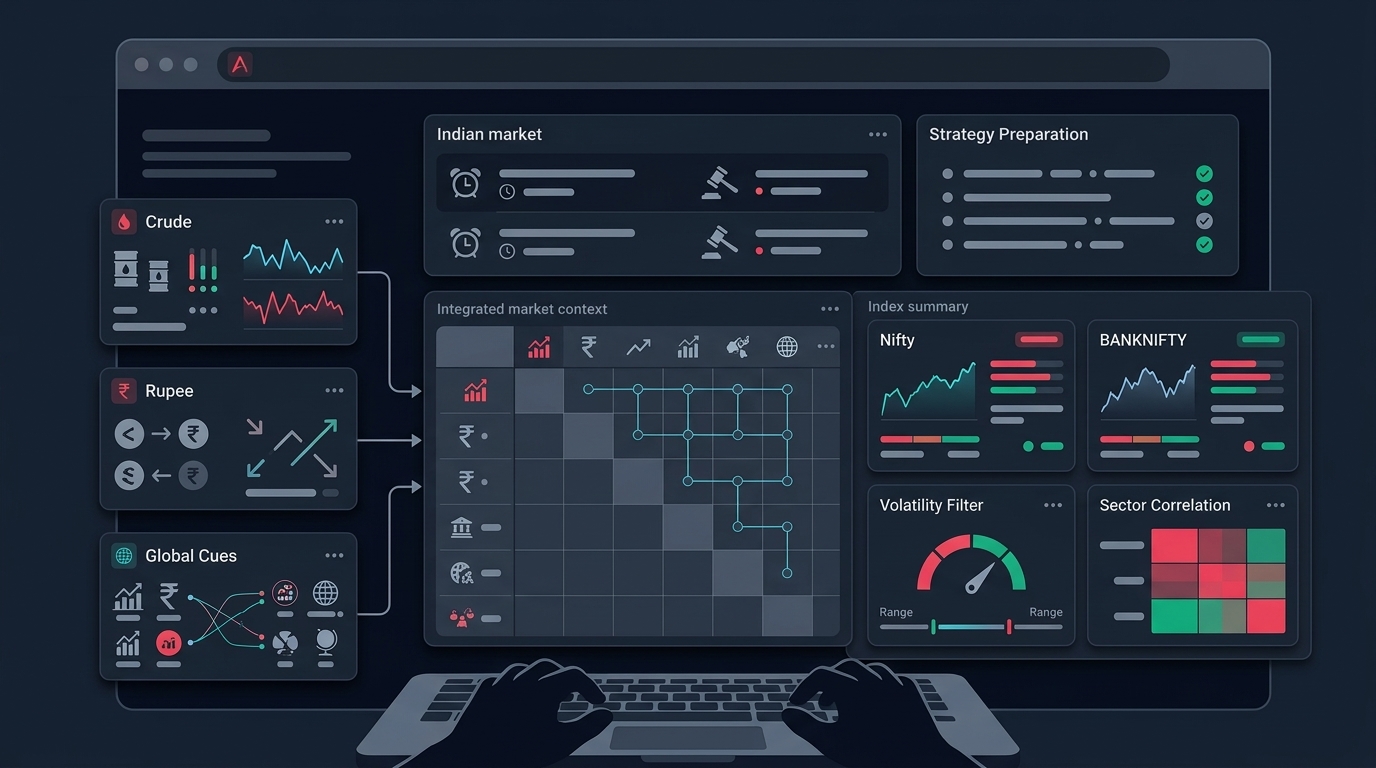
Late July 2026 has been a reminder that Indian markets do not trade in isolation. Brent went from crossing $95 mid-month, to briefly above $100, to dipping below $90 by July 30 — with 5% and 10% moves compressed into single sessions as US-Iran headlines swung between strikes, pauses, and talk of peace talks. On July 22, Sensex and Nifty fell sharply on a combination of crude, rate fears, weak Q1 numbers from HCL Tech, a weaker rupee and soft global cues. A week later, indices rose over a percent despite an oil spike, helped by a stronger rupee and renewed FII buying.
If you are running systematic strategies, that last sentence is the important one. The same input — crude up — produced opposite index outcomes within days. Which means the useful question for an algo trader is not "what will crude do to Nifty." It is "what does my system do when volatility regime and overnight gap behaviour change, and do I know that before it happens?"
This post is about turning that news flow into process. No calls, no targets. Just filters, checks, and the boring work that decides whether a strategy survives a month like this one.
Why "global cues" break systems, not just sentiment
Most retail strategies are built and backtested in a normal regime. Then a geopolitical window arrives and three things change at once.
Overnight gaps widen. Indian markets are shut when the US session, Brent futures and Asian markets react. A headline at 11 PM IST is fully priced into the 9:15 AM open. Any strategy carrying overnight positions — swing systems, positional option shorts, hedged spreads — inherits that jump with no chance to manage it.
Intraday range expands unevenly. A day that opens quiet can double its range after a mid-session wire story. Strategies calibrated on average true range from a calm month will size positions as if the day is calm.
Correlation between "independent" positions collapses to one. You may have five separate stock signals from your scanner — an OMC, a paint company, an airline, a tyre maker, a chemicals name. In a crude-driven session, those five are one trade: a bet on input costs. Your risk model thinks you have five uncorrelated positions. You have one, sized 5x.
That third point is the one that quietly does the most damage, and it does not show up in a per-trade stop loss. It shows up in your daily drawdown.
The seven triggers, translated into system inputs
The Financial Express framing of the current setup lists seven triggers: crude oil, the rupee, bond yields, foreign flows, safe-haven demand, sectoral impact, and global market cues. That is a good analyst checklist. For a systematic trader it needs converting into something a rule can read.
Here is a rough translation, not a formula:
Crude → an overnight gap-risk input and a sector-correlation flag. India imports roughly 85-90% of its crude, so a sustained move flows into inflation expectations, the currency, and margin pressure for oil-sensitive sectors like paints, aviation, tyres, and chemicals. For your system, the practical form is: is today a day when my sector exposure is secretly concentrated?
Rupee → a stress gauge. A weakening rupee alongside falling indices is a different picture from a weakening rupee alongside strong FII inflows. Note that on the day indices rose over a percent despite the oil spike, the rupee was strengthening. Direction alone tells you little; the combination is the signal.
Bond yields → a slower-moving regime marker. Yields moving on fiscal anxiety change the discount rate the whole market runs on. This is a weekly input, not an intraday one.
FII flows → the flow that decides whether index dips get bought. Renewed FII buying was cited as a factor in the late-July recovery. Treat it as a confirmation variable, never a leading one — you see it after the close.
Safe-haven demand and global cues → mostly a volatility-regime proxy. If gold is bid and global indices are choppy, expect wider Indian ranges. Kospi falling 10% in a session on a semiconductor selloff, while US-Iran news read as optimistic, is a clean example of how global cues can be non-obvious and sector-specific rather than uniformly risk-on or risk-off.
You do not need all seven wired into code. You need two or three that measurably change your strategy's behaviour, and you find those through testing, not intuition.
Build regime filters, not prediction models
The temptation during a news-heavy stretch is to add a discretionary override: "if crude is up more than 3%, skip trading." That feels prudent. It is usually untested.
A better approach is to define regime buckets and check how your strategy behaved in each historically.
A workable structure:
- VIX bucket. Split your backtest into low, medium and high India VIX terciles. Option selling systems in particular need this — a short strangle that looks steady in a 12 VIX world behaves very differently when VIX is elevated and moving. This is worth a dedicated pass; the mechanics are covered in more depth in our writeup on VIX regime filters for option selling.
- Gap bucket. Tag every session by the overnight gap in the underlying. Then check: what fraction of your total loss came from sessions with a gap above 0.75%? If a small number of gap days drive most of your drawdown, that is a sizing problem, not a signal problem.
- Range-expansion bucket. Compare the day's realised range against a 20-day average. Some breakout systems only work in expansion; some mean-reversion systems only survive in contraction.
The output is not a prediction. It is a sizing and participation rule you can defend: "in the top VIX tercile, this strategy's average loss per losing trade is 1.8x the normal-regime figure, so I halve size there." That is a statement your backtest can support.
Anadi's backtesting workflow exists for exactly this kind of segmentation — you want to see the same strategy sliced by conditions, not one blended equity curve that hides the bad regime inside the good one.
Event windows: what to skip and how to decide
Not every event deserves avoidance. Blanket rules cost you real edge if the strategy actually handles the event fine.
The honest test is a subtraction check. Run the backtest with all sessions. Then run it excluding the event-window sessions. Compare:
- Did net P&L improve or just get smaller?
- Did maximum drawdown shrink meaningfully?
- Did the number of trades drop so much that the remaining sample is too small to trust?
If excluding a window improves risk-adjusted results and leaves you with enough trades, skipping is justified. If excluding it just trims a symmetric slice off both sides, you are removing variance and edge together.
For the current environment, the windows worth explicitly testing are:
Overnight-carry sessions during active geopolitical escalation. Not because the direction is knowable, but because your ability to manage the position is suspended for 17 hours.
Weekly expiry that coincides with a scheduled macro event. Gamma exposure and event risk stack multiplicatively, not additively.
The first 15 minutes after a gap opening above your threshold. Spreads are wide, and stop-loss orders placed into that liquidity get filled badly. This is a slippage question, and if your backtest assumes mid-price fills, it is understating the cost. Worth reading alongside our note on slippage and brokerage costs in backtests.
Sessions where multiple oil-sensitive signals fire together. Cap the count, not just the per-trade risk.
Practical workflow checks for the next two weeks
Concrete things to verify, in rough priority order.
Position and correlation caps
Set a hard cap on concurrent positions in a single macro theme. If your scanner surfaces four oil-sensitive names, treat them as one unit for risk purposes. In practice this means a sector or theme tag on every signal and a rule that counts exposure by tag rather than by symbol.
This is where a filtering layer earns its keep. Anadi's Action Center sits between raw scanner output and execution — it ranks candidates, shows freshness and signal stage, and surfaces blocked reasons like chase distance or invalidated price. During a volatile stretch, "the signal fired but price has already run past the entry" is the most common way retail traders convert a good setup into a bad fill.
Daily loss limit that actually halts
A daily loss limit only works if it stops new entries automatically. A limit you have to remember to enforce during a fast session is not a limit. Check that yours is wired into the execution path and test it in paper trading before you need it. Set it as a fixed rupee or percentage figure decided before market open, not adjusted mid-session.
Slippage assumptions revisited
Re-check your backtest's slippage model against what you actually got filled at over the past two weeks. If your live fills in options are consistently worse than the model, your entire expectancy calculation is off, and the gap is widest precisely on volatile days.
Broker and connectivity checks
Volatile sessions are when order rejections, session expiries, and rate limits show up. Verify your token refresh is working, check that rejection handling retries sensibly rather than firing duplicates, and confirm you get an alert when the connection drops. A strategy that is correct but disconnected is a strategy that is wrong.
Margin headroom
If you are running hedged option structures, check margin under a stressed scenario, not the current one. Margin requirements can move intraday with volatility. Running at 90% margin utilisation in a calm week becomes a forced exit in a volatile one.
Option chain validation before acting
Before executing on any option signal during elevated volatility, look at the chain: liquidity at your intended strike, bid-ask width, and whether the OI structure supports what your rule assumes. A strike that was liquid last month may not be this week. Anadi keeps chain inspection, basket preview and margin estimate in one options workflow so this check happens before the order, not after the fill.
What not to do with this information
A few failure modes worth naming, because they are common.
Do not build a crude-to-Nifty rule from one month of data. July 2026 alone gave you sessions where crude up meant markets down, and sessions where crude up meant markets up. Two observations do not make a relationship.
Do not add filters until the backtest looks good. Every filter you add on the same dataset increases the chance you have fit noise. If you tested six regime filters and one improved results, that one is probably luck. Our post on how overfitting makes a backtest look profitable covers the mechanics.
Do not confuse "I read the news" with "I have an edge." By the time a headline reaches you, it is in the price. What you can control is exposure, sizing, and whether you participate at all.
Do not override a systematic strategy mid-session because the news feels scary. If you need discretion, define the override rule in advance, in writing, with a specific trigger. An undefined override is just fear with extra steps.
A short checklist
Before the next volatile open, run through this:
- Do I know my current exposure by macro theme, not just by symbol?
- Is my daily loss limit wired into execution, or is it a note in a diary?
- Have I segmented my backtest by VIX regime and gap size?
- Does my slippage assumption match my actual fills from the last two weeks?
- Is my margin utilisation low enough to survive an intraday volatility jump?
- Do I have overnight-carry rules that are explicit, or do I decide at 3:20 PM based on mood?
- Are my broker session, order rejection handling, and disconnect alerts all verified working?
- If I want to skip an event window, have I run the subtraction test to confirm skipping actually helps?
Anything you answer "no" to is a project, not a panic. Fix them in order of how much money they can cost you.
Market context like the current crude and currency setup is most useful as preparation. Our weekly market outlook is built on the same principle — read the environment to adjust risk and participation, not to chase directional calls. If you want to segment your own backtests by regime and test event-window rules against your actual strategy, you can get early access here.
The traders who come through months like this one intact are rarely the ones who predicted the headlines. They are the ones whose position sizing already assumed something like this would happen.