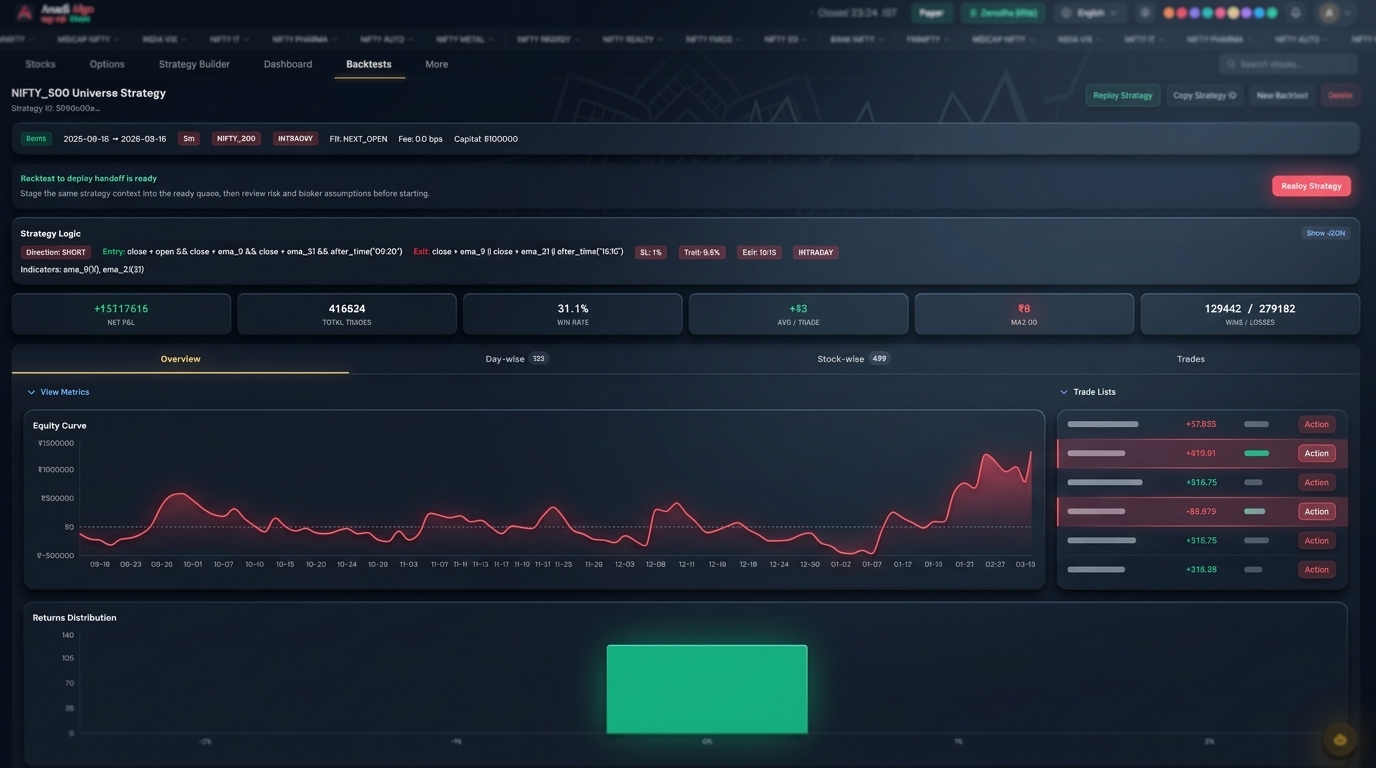
Most option-selling backtests in India look beautiful on paper. Smooth equity curve, decent win rate, drawdowns that feel manageable. Then you trade it live on a Thursday or Wednesday expiry and a single move erases a month of theta.
The problem is rarely the strategy logic. It is the assumption that expiry day behaves like every other day. It does not. And if your backtest treats it the same way, you are not measuring edge — you are measuring an illusion.
This post is about how to backtest Nifty and BANKNIFTY expiry-day strategies in a way that survives contact with the live order book.
Why expiry day is a different animal
Three things change on expiry day, and all three break standard backtest assumptions.
Gamma rises sharply. As time to expiry collapses, the rate at which delta changes (gamma) explodes for at-the-money strikes. A 20-point move in Nifty in the last two hours can turn a 5-delta short call into a 40-delta short call in minutes. Your backtest, which assumes linear option pricing or uses end-of-minute snapshots, will not capture this.
Theta is front-loaded but uneven. Premium decay is not smooth. The last hour of expiry compresses extrinsic value violently, but it is also the window where IV crush reverses if the index makes an unexpected move. Backtests using simulated Black-Scholes prices often overestimate clean theta capture.
Liquidity behavior changes. Deep OTM strikes that looked tradable on the chain at 11 AM can become untouchable at 2:30 PM. Spreads widen. Bid-ask gaps appear. If your backtest uses LTP fills, you are silently assuming infinite liquidity at the printed price.
These three forces compound. A loss that looks like a small drawdown in a normal-day backtest can be 4-5x worse on expiry, and your historical curve will not show it unless you test expiry days separately.
Step one: segment your backtest by day of week
Before doing anything fancy, just split the results. Run your strategy across the historical window, then bucket trades by:
- Monday / Tuesday entries
- Wednesday entries (BANKNIFTY expiry until late 2023, then shifted)
- Thursday entries (Nifty expiry)
- Friday entries
Look at the per-bucket stats separately. Win rate, average win, average loss, maximum adverse excursion (MAE), and standard deviation of returns.
If your expiry-day bucket shows a fatter left tail — bigger losses, higher variance, more outliers — your aggregate numbers are hiding risk. A 65% strategy win rate with a 90% non-expiry win rate and 35% expiry win rate is a completely different animal from a uniform 65%.
This is the simplest sanity check, and most retail options backtesting setups skip it entirely.
Step two: model slippage realistically on expiry
Default slippage assumptions in retail backtests are usually one of:
- A flat 0.5 or 1 point per leg
- A fixed percentage of premium
- No slippage at all (the worst)
None of these match expiry behavior. A more honest model uses tiered slippage based on:
Strike distance from spot. ATM strikes on Nifty expiry typically fill within 0.25-0.5 points of mid. Strikes 200-300 points OTM can have spreads of 1-2 points, and far OTM strikes in BANKNIFTY can show 3-5 point spreads in the last hour.
Time of day. Slippage between 9:15 and 10:00 is different from 14:30 to 15:30. Backtest fills around 15:15-15:25 — when many systems trail stops or square off — and you will see the real cost.
Direction of trade. Exiting a losing leg into a fast-moving market is far costlier than entering at calm hours. If you only model symmetric slippage, you are underestimating stop-loss costs.
A reasonable starting point: double your normal-day slippage assumption for expiry-day exits, and triple it for stop-loss hits during the last 90 minutes. Then look at how the equity curve changes. If your strategy still works, you have something worth paper-trading.
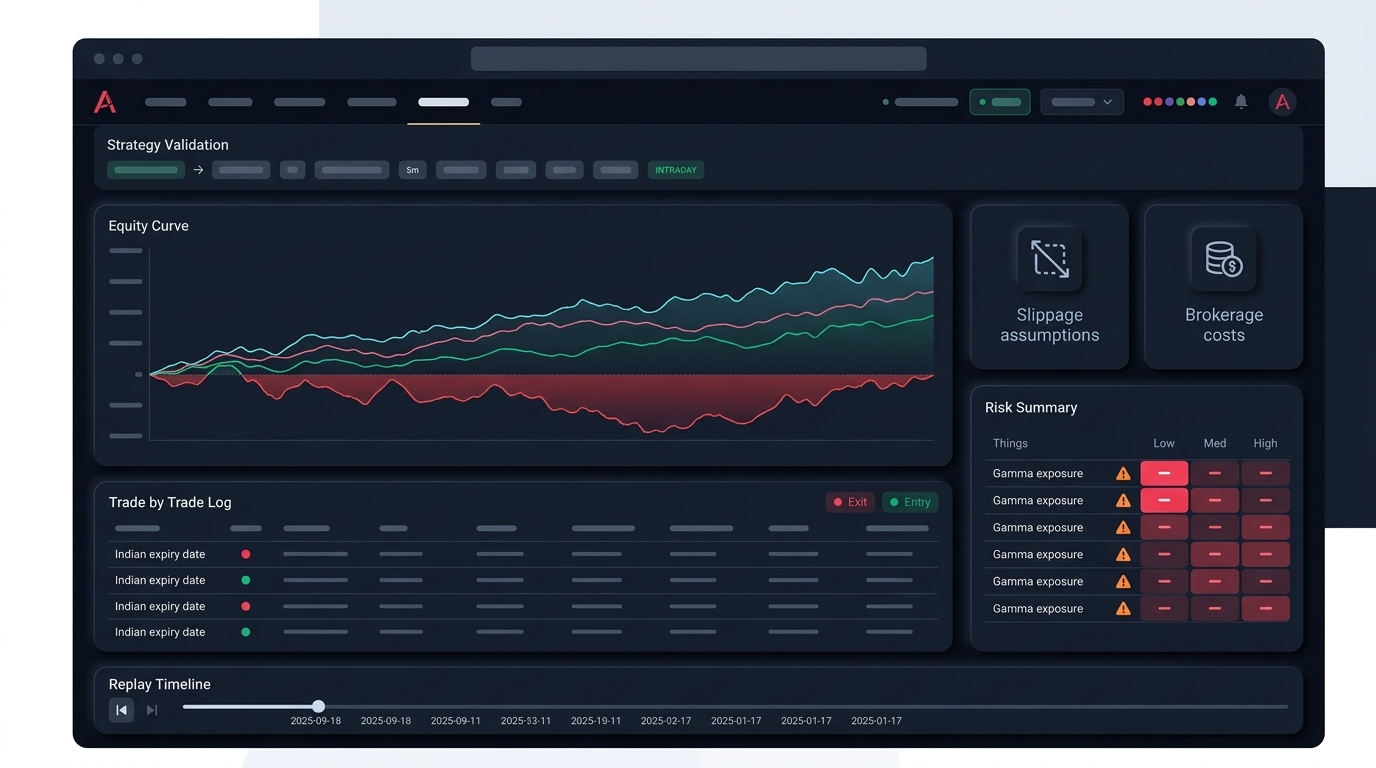
Step three: test gamma scenarios explicitly
Standard backtests are reactive — they replay history. But expiry-day risk is about what could have happened that did not. A short straddle that sat quietly through 50 expiries can blow up on the 51st when the index moves 1.5% in the last hour because of a global cue, an RBI surprise, or simply an index-rebalance flow.
Build a small scenario layer on top of your backtest:
- What happens if Nifty moves 0.75% between 14:00 and 15:20 against your position?
- What happens if BANKNIFTY moves 1.2% in the same window?
- What happens if implied volatility spikes 3-4 vol points alongside that move?
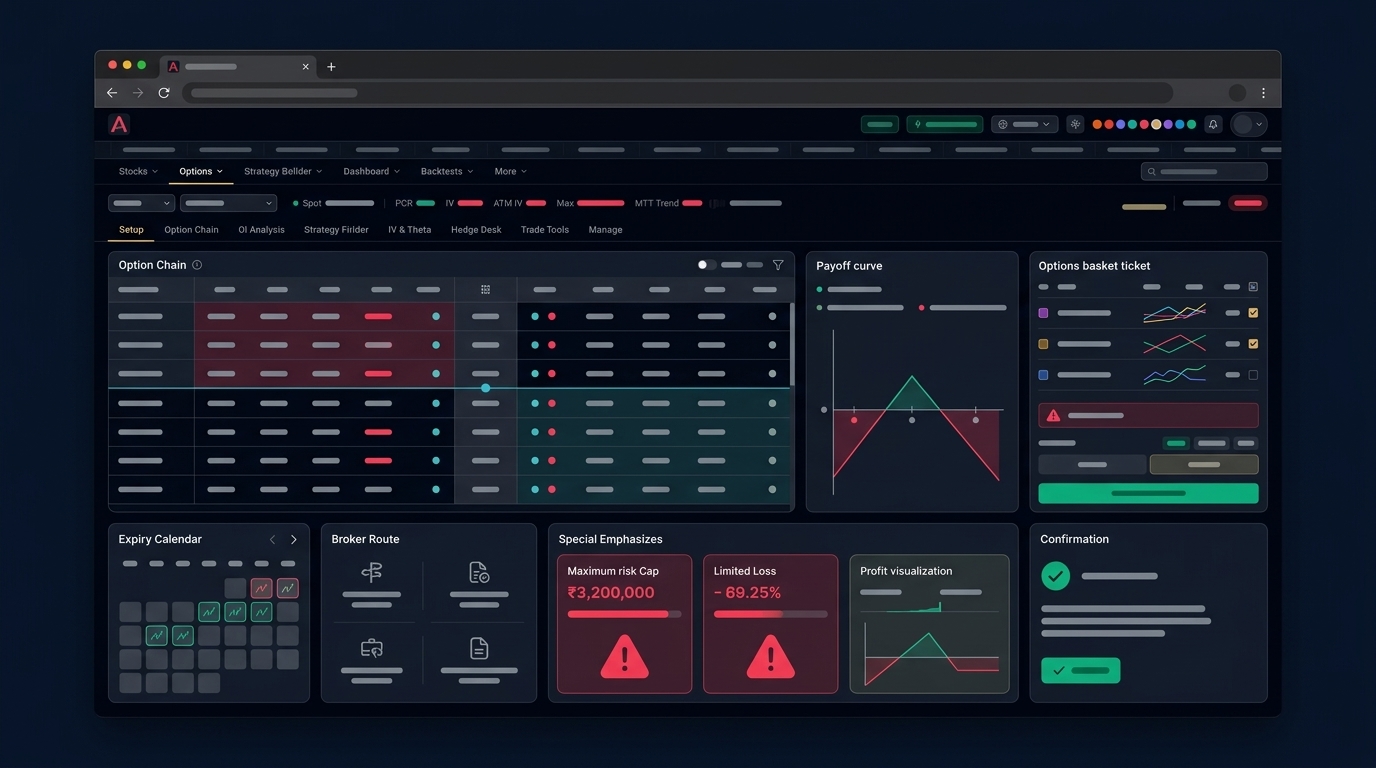
You do not need a full Monte Carlo engine for this. A spreadsheet that recomputes option prices at stressed inputs is enough to see whether your stop-loss design actually contains the damage or just slows it down.
This kind of stress test is also where risk management rules get tested honestly — does your per-trade max-loss cap actually hold when gamma decides otherwise?
Step four: watch for survivorship in your sample
A subtle trap: if you are pulling expiry-day data from the last 2-3 years and the bad days are missing from your sample, your backtest is structurally optimistic.
Make sure your dataset includes:
- Budget day expiries (high gap, high IV)
- RBI policy day expiries
- US Fed day overlaps
- Index-rebalance expiries
- Days with overnight gaps above 0.5% on the index
If your sample is mostly calm expiries, the strategy you are validating is one that works on calm expiries — not on the next event-driven one.
Step five: separate the backtest from the deployment plan
This is where most retail strategies fall apart. The backtest says positive expectancy. The trader deploys at full size on day one. The first ugly expiry takes out three months of profit.
A safer deployment after expiry-day validation looks like:
- Forward test on paper trading for at least 6-8 expiries.
- Compare paper-trade fills against backtest fills. If slippage is wider, recalibrate.
- Deploy at one-quarter size for the next 6-8 expiries.
- Scale only if live results stay within one standard deviation of backtest results.
This is slower. It is also the difference between a strategy that compounds and one that bleeds.
A short checklist before you trust an expiry backtest
- Have you split results by day of week and looked at expiry-day stats separately?
- Did you model slippage with time-of-day and strike-distance awareness?
- Did you stress-test the position against a sharp 0.75-1.5% move in the last 90 minutes?
- Does your dataset include event-day expiries, not just calm ones?
- Have you compared backtest fills against at least one round of paper trading?
- Is your max-loss-per-trade cap enforced at the strategy level, not just hoped for?
If you cannot tick all six, the backtest is a draft, not a green light.
Expiry day rewards conservative assumptions and punishes optimistic ones. The traders who survive multiple expiry cycles are usually the ones whose backtests underpromised — they expected slippage, planned for gamma, and sized accordingly.
If you are building a strategy and want a workflow that handles per-day segmentation, realistic fills, and live-paper comparison in one place, you can try Anadi Algo through early access and see if it fits the way you test.
The market does not care how good your equity curve looks. It cares whether your assumptions survive the next Thursday afternoon.