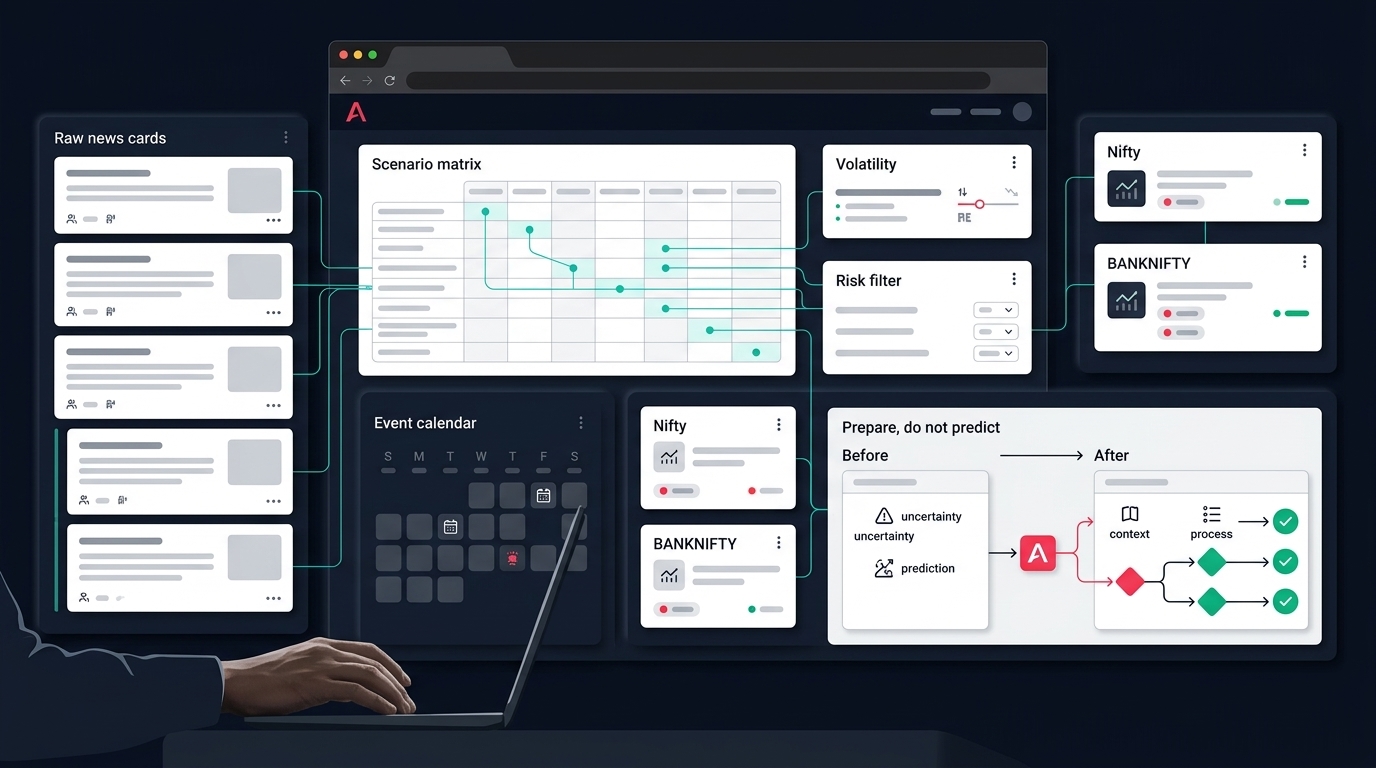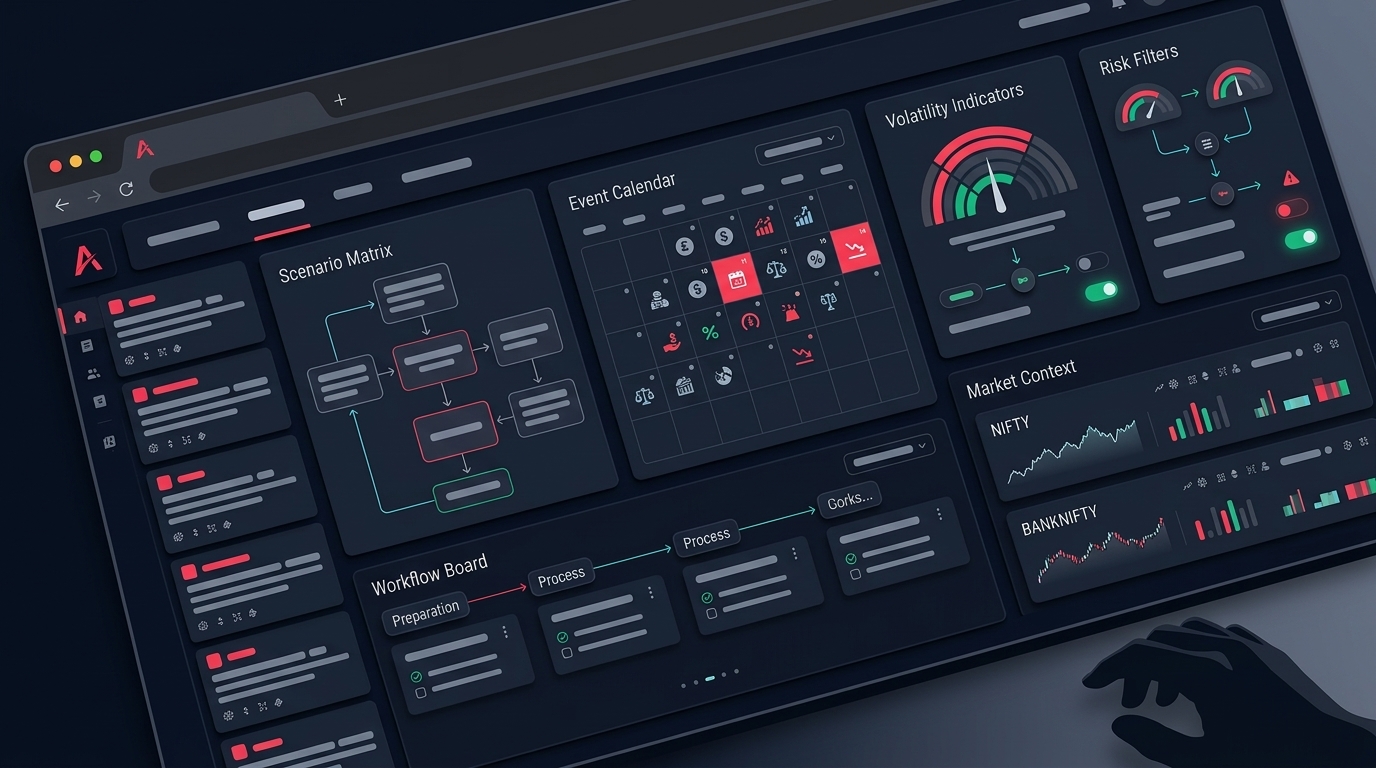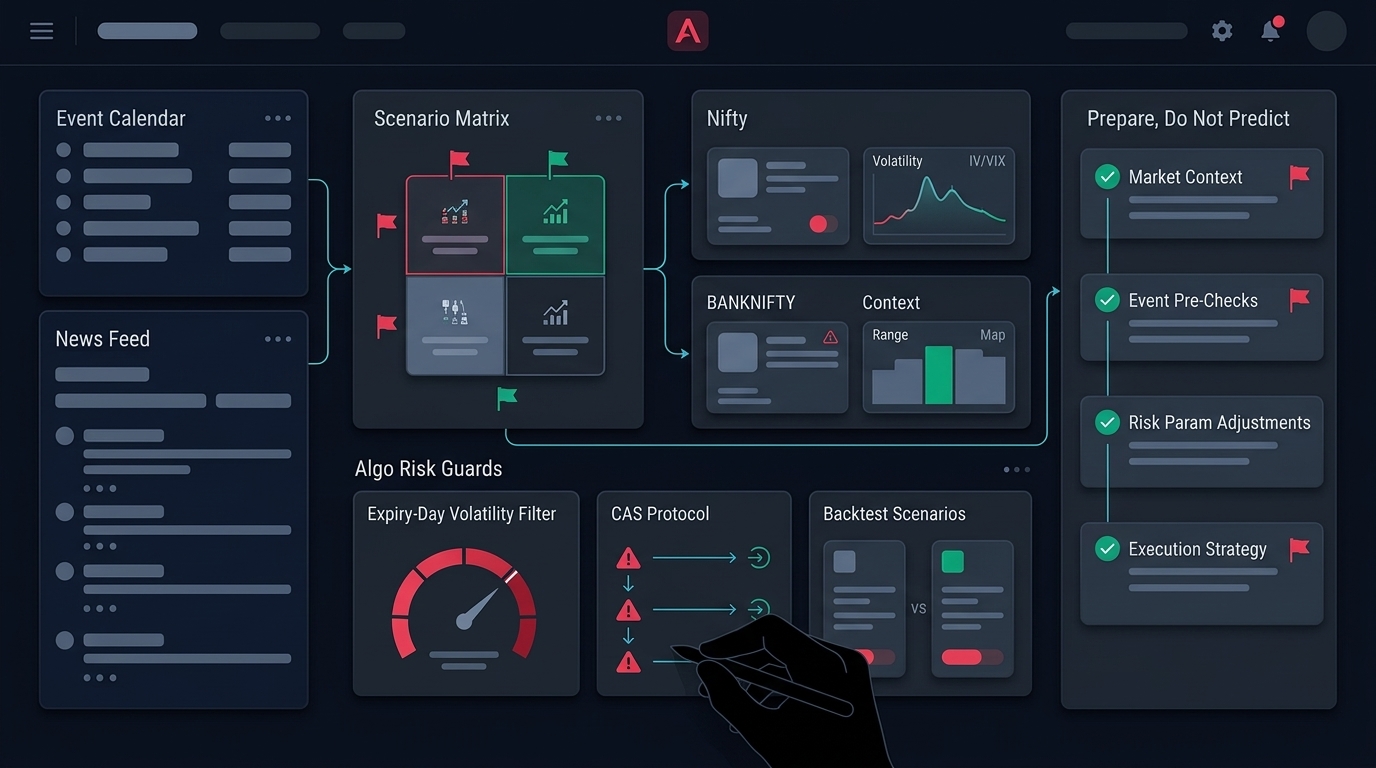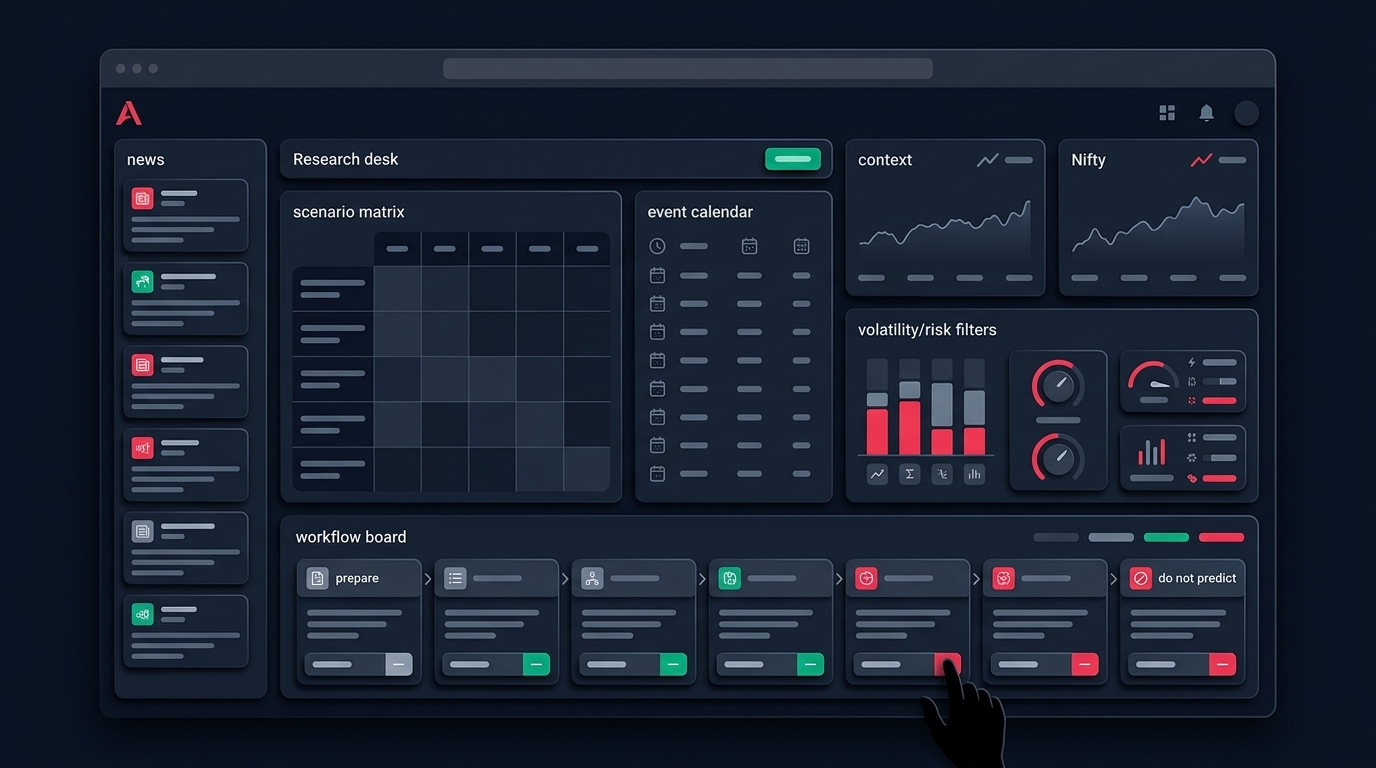
On October 12, 2026, market summaries described Indian benchmarks recovering after a stretch of choppy sessions, with volatility cooling off and buying spread across sectors rather than concentrated in one or two names. One dashboard tracking live levels showed Nifty up over a percent on the day, with sector tiles mostly green.
That is a pleasant-sounding paragraph. It is also nearly useless as a trading input, because it does not tell you the one thing an options algo needs to know: were premiums expensive or cheap relative to how the index has actually been moving?
"Volatility fell" and "options got cheap" are not the same statement. A falling India VIX with still-elevated realised movement is a different regime from a falling India VIX with a dead tape. Your short-premium strategy will behave very differently in the two. This post is about reading the volatility picture as a dashboard of several numbers, then converting it into risk filters your system can actually act on — not into a directional call.
A single volatility number is a summary, not a signal
India VIX is an index-level measure derived from Nifty option prices. It is useful as a regime thermometer. It is not a per-instrument answer.
Three problems show up the moment you wire it directly into a strategy:
- It is Nifty-specific. Bank Nifty option pricing, and especially F&O stock options around results, routinely behave differently. Using one index VIX as a gate on a stock-option strategy mismatches the instrument you are trading.
- It has no memory. A VIX print of 13 means nothing on its own. Thirteen is low if the last year ranged 11 to 25. It is not low if the year ranged 9 to 14.
- It is a level, not a relationship. The number that actually decides whether a premium seller is being paid fairly is implied volatility compared to realised volatility, not implied volatility in isolation.
A volatility dashboard — the kind that puts India VIX, ATM implied volatility, IV Rank, IV Percentile, the IV-versus-historical-volatility gap, expected move, skew and term structure on one screen — exists to fix exactly those three gaps. Public dashboards describe their purpose plainly: help buyers, sellers and spread traders judge whether premiums are relatively cheap, fair or expensive, and confirm against price action, chain, OI change, PCR, liquidity and event risk before acting.
The useful move for an algo trader is to stop reading those numbers as opinions and start treating each one as a named input with a defined range.
The six readings and what each one is for
IV Rank
Where today's implied volatility sits between the lowest and highest IV of the lookback window, usually a year. IV Rank near 80 means current IV is close to the top of that range. Near 15 means it is near the bottom.
What it fixes: the no-memory problem. It makes "high" and "low" mean something specific for that instrument.
Where it misleads: a single extreme spike inside the lookback window compresses everything after it. One panic week can make a genuinely elevated tape look mid-range for the next eleven months.
IV Percentile
The share of days in the lookback when IV closed below today's level. If IV Percentile is 70, IV has been lower than today on roughly 70 percent of days.
What it fixes: the single-spike distortion in IV Rank. Percentile counts days, so one outlier cannot dominate.
How to use both: read them together. Rank high but percentile low usually means you are looking at a fresh spike. Rank and percentile both high means the elevated condition has persisted. Those two situations call for different holding assumptions, even though a "high IV" alert would fire identically for both.
IV minus historical volatility
Implied volatility is a forward price. Historical (realised) volatility is what actually happened. The gap between them is the closest thing to an honest answer on whether premium is rich.
Positive and wide: options are pricing more movement than the index has been delivering. Negative: options are pricing less movement than it has been delivering — the harder environment for naked short premium, and the one that reads as "safe" on a VIX-only dashboard because the absolute number may be unremarkable.
Practical habit: log the spread daily alongside your strategy's realised P&L. Over a quarter you will usually find your short-premium rules were earning in a narrow band of the spread and bleeding outside it. That band is a filter you can code.
Expected move
The move size the option market is implicitly pricing for a period — a week, an expiry, an event. It converts abstract volatility into points.
This is the number that should set your stop distances and your strike selection, not a fixed point value you chose months ago. A 150-point Bank Nifty stop is a wide stop in one regime and a coin flip in another. If your stop is a constant while expected move doubles, you have unknowingly changed strategies.
Skew
The IV difference across strikes — typically puts priced richer than calls in index options. Skew widening tells you downside protection is getting bid, which matters even when the headline index is green.
For algo work the useful form is a tracked value, not a vibe. Record ATM IV, a fixed-distance OTM put IV and the equivalent call IV each day. The spread between them is your skew series. A skew series that widens while the index rises is a different tape from one that flattens on the same move.
Term structure
How IV changes across expiries. Near-expiry IV above far-expiry IV (inversion) usually signals a concentrated near-term event. Normal upward slope suggests the market is not pricing anything unusual immediately ahead.
Inversion is one of the cleanest mechanical event-avoidance triggers available, because it is derived from prices rather than from a news feed you have to parse.
Converting readings into risk states, not into calls
The temptation is to write a rule like "if IV Rank is above 70, sell premium." Don't. That is a directional strategy wearing a volatility costume.
A better pattern is to define a small set of named regime states and attach risk behaviour to each, leaving entry logic to your actual strategy.
- State: rich and quiet. IV Rank high, IV above realised volatility, term structure normal, no event inside the holding window. Premium structures are being paid relatively well. Normal size for defined-risk short strategies; still hedged.
- State: rich and moving. IV Rank high but realised volatility running at or above implied. Premium looks attractive and is not. Reduce size, prefer defined-risk structures over naked, widen stops in line with expected move — and expect more stop hits per week, which your daily loss limit must accommodate.
- State: cheap and quiet. IV Rank low, realised volatility low, nothing on the calendar. Directional buyers face theta drag with little movement to pay for it. Debit spreads and calendars fit the condition better than outright long options.
- State: cheap and pre-event. IV Rank low but term structure inverting, or a known event inside the window. Low IV here is a warning, not a discount. Reduce new exposure; do not size up because options "look cheap."
- State: inconsistent. Dashboard readings disagree — IV Rank high, percentile low, skew flat, VIX falling. Treat disagreement as its own state with reduced size. Most of the worst algo days come from acting with full conviction on a tape that was giving mixed inputs.
Notice that none of these states say what to buy or sell. They say how much risk is appropriate and which structure fits the condition. That is the part a system can enforce consistently.
The October 12, 2026 context is a good example of why the "inconsistent" state needs to exist. A cooling volatility reading plus a broad recovery session can mean the elevated regime genuinely resolved, or it can mean one calm session inside an unsettled stretch. The dashboard tells you which is more likely over the next few sessions only if you are tracking whether realised volatility is actually following implied volatility down. If it is not, calm pricing and a jumpy index are coexisting, and short-premium rules calibrated on a quiet quarter will be mispriced.
Event avoidance belongs on the same screen
Volatility dashboards commonly carry an events-ahead section for a reason: the calendar is part of the volatility reading, not a separate concern.
For Indian markets the recurring items worth a coded block or a size reduction include weekly and monthly expiries, scheduled RBI policy decisions, CPI and other macro prints, quarterly results for F&O stocks you trade options on, and Budget sessions. Global overnight events — Fed decisions, major US earnings that move the chip and tech complex, energy moves that feed into the rupee — show up as gap risk in Indian hours rather than as intraday volatility.
Two rules that cost nothing to implement:
- No new premium-selling exposure inside a defined pre-event window for events your strategy was not backtested across.
- Flat-or-hedged before any event you cannot model. "Cannot model" includes anything with fewer than a handful of historical instances in your data.
If you find these rules expensive — they will visibly reduce your trade count — that is worth knowing. Run the comparison properly in options backtesting with the event dates excluded versus included, and look at the tail of the distribution rather than the average. Most event-day edge in retail backtests disappears once slippage and the single worst day are treated honestly.
Backtest checks your volatility assumptions should force
A volatility-aware strategy needs volatility-aware validation. Four checks catch most of the self-deception:
- Bucket results by IV Rank. Split your backtest into low, mid and high IV Rank buckets and read the P&L of each separately. A strategy that is profitable only in one bucket is a regime bet. Know which bet you are making.
- Bucket by IV-HV spread. Same exercise with the implied-versus-realised gap. This is usually more revealing than IV Rank for premium strategies.
- Check whether your stops scaled. If your backtest used a fixed point stop across years where expected move changed materially, your stop was effectively tightening and loosening at random. Re-run with stops expressed as a fraction of expected move or of ATR and compare.
- Count the trades in your best bucket. If 80 percent of profit comes from 12 trades in one high-IV quarter, you have a small-sample result, not an edge. Sample size in the bucket that matters is the number worth reporting to yourself.
These checks also tell you where to put your risk management limits. A per-day loss cap derived from a calm-regime backtest will be hit repeatedly in a volatile one — not because the strategy broke, but because the cap was calibrated on the wrong distribution.
Where these checks sit in an actual trading day
The dashboard is only useful if it is consulted before execution rather than after a loss.
A workable sequence for an options day:
- Pre-open context. Index and sector picture, global cues, overnight gaps. The point is regime framing, not a view.
- Volatility readings. India VIX, instrument-level ATM IV, IV Rank and percentile, IV-HV spread, term structure, skew. Write down the state name.
- Calendar check. Anything inside the intended holding window? If yes, the state downgrades regardless of how good the premium looks.
- Structure selection. Does the current state favour buying, debit spreads, credit spreads with hedges, or sitting out?
- Size and risk budget. Set from the state, before strikes are chosen. Margin estimated with existing positions included, not in isolation.
- Execution. Only now does the strike and order ticket matter.
In Anadi Algo this maps onto one workspace rather than six browser tabs. The options desk at /options keeps setup, option chain, OI analysis, strategy finder, a dedicated IV and theta tab, hedge desk, trade tools and position management side by side, with margin estimated against your open positions before a basket goes out. The index cards and sector heatmap at /indices give the step-one context. The Action Center layer applies the same discipline on the stock and F&O side, ranking scanner candidates and tagging blocked reasons such as chase distance or invalidated price, so a late entry gets flagged rather than filled.
The design intent is the one worth copying even if you build your own stack: risk and volatility context appear before the order ticket, not after. Our weekly market outlook is written on the same principle — use context to prepare rules, not to chase calls.
If you want to run this process inside one options and strategy builder workflow instead of stitching it together manually, you can request early access and test it on paper first.
Checklist
Before your next options session:
- Record IV Rank and IV Percentile for the instrument you trade, not just India VIX.
- Log the IV-minus-realised-volatility gap daily. It is the single most informative number for premium strategies.
- Express stops and strike distances as a function of expected move, not as fixed points.
- Track a skew series — ATM IV versus fixed-distance OTM put and call IV.
- Check term structure for inversion as a mechanical pre-event warning.
- Name today's regime state before choosing a structure, and let the state set size.
- Keep a defined no-new-exposure window around events your backtest never saw.
- Bucket every backtest by IV Rank and by IV-HV spread before trusting the headline number.
- Review the worst five days in each bucket, not the average.
None of this predicts where Nifty or Bank Nifty goes next. That is the point. A volatility dashboard is for deciding how much risk the current environment justifies and which structure fits it — and that decision is one you can make the same way every day.