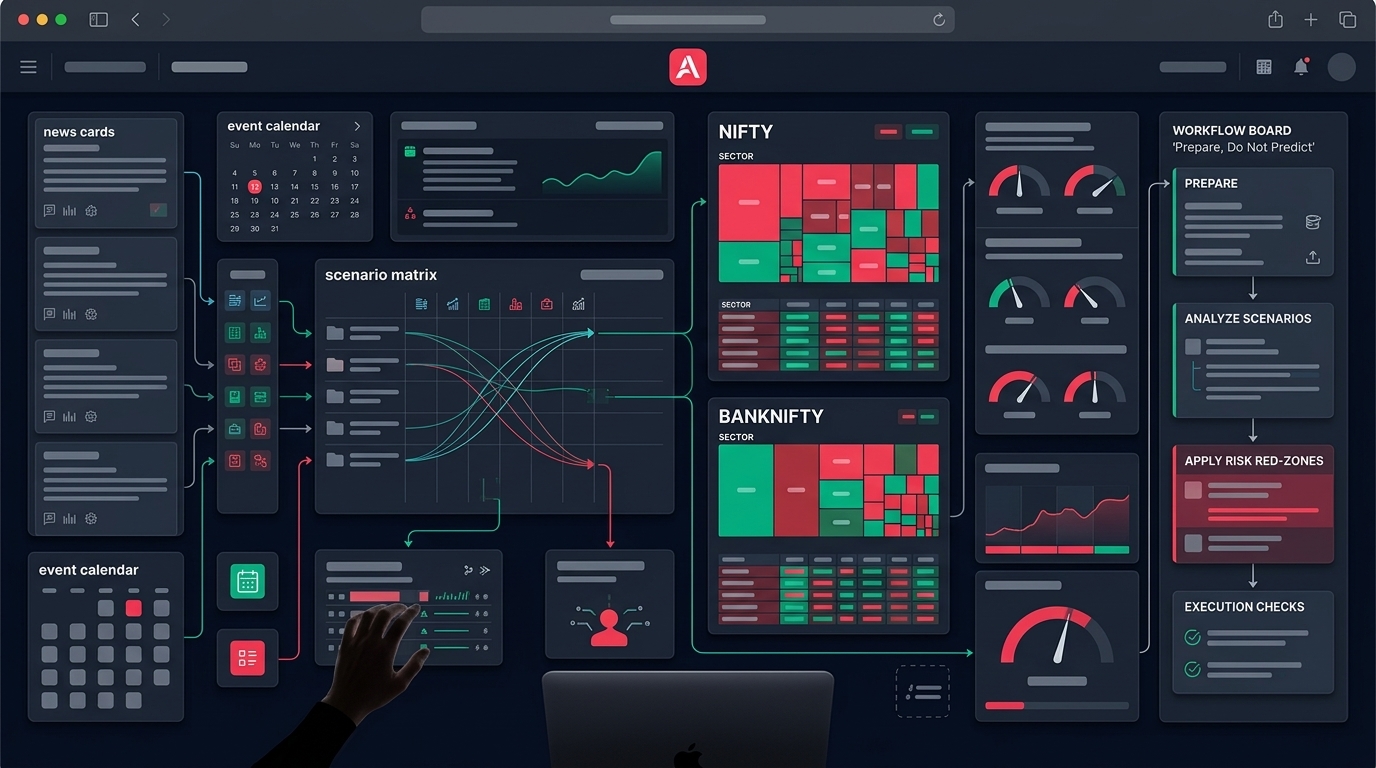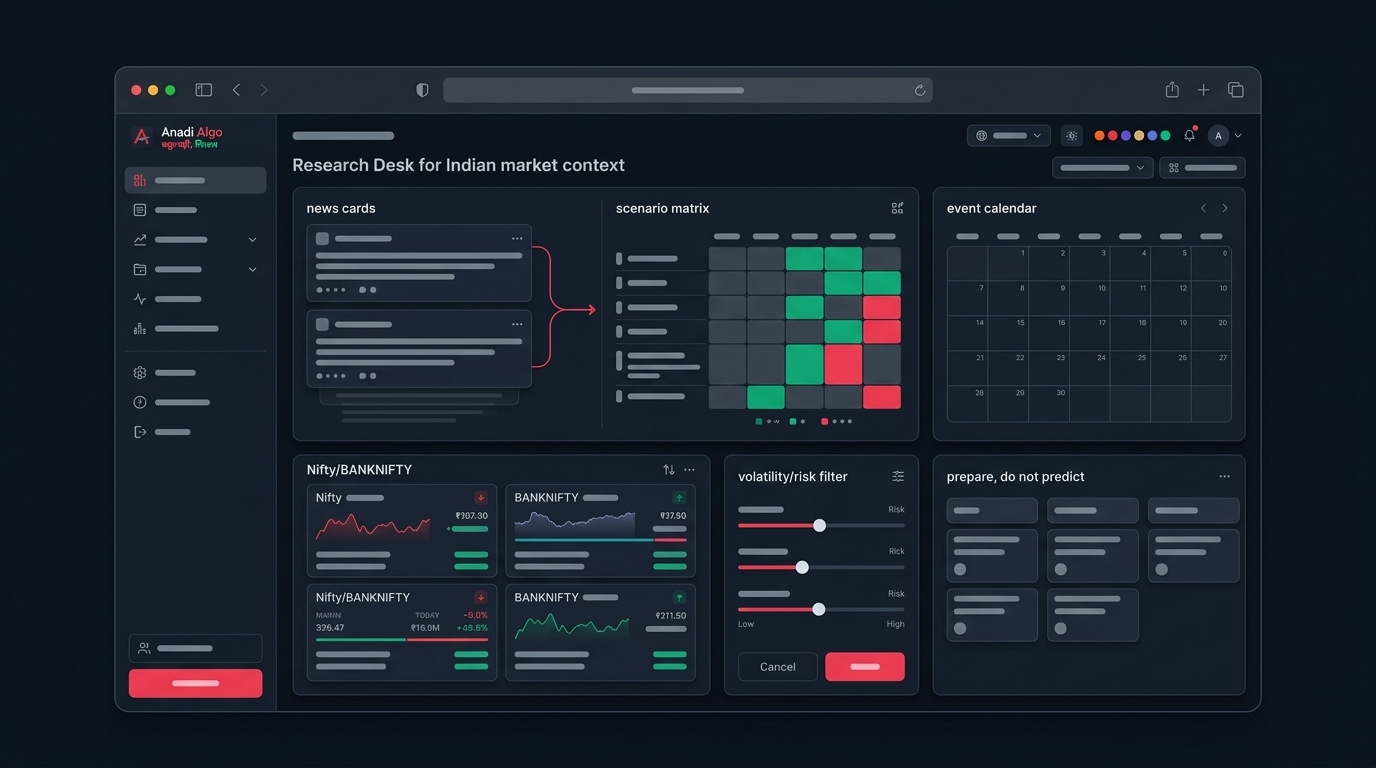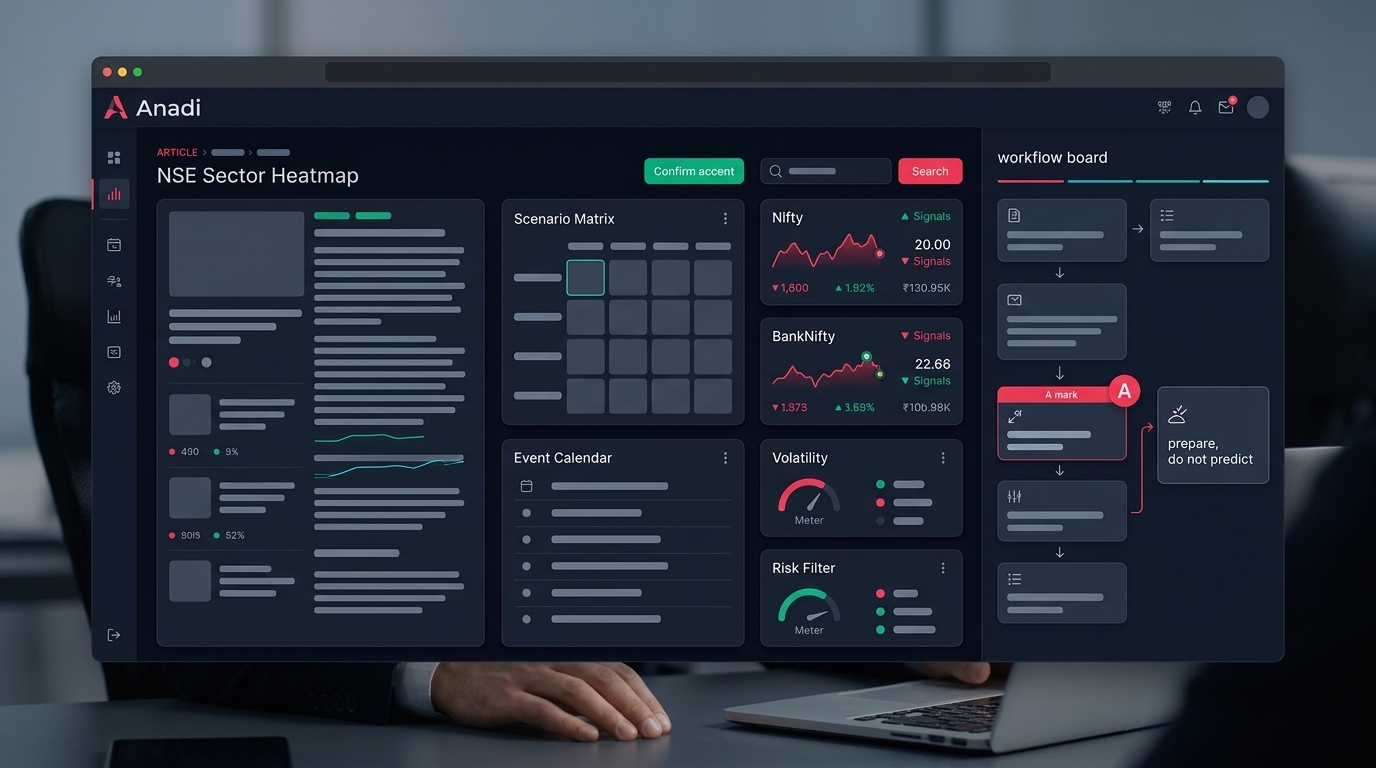
A sector heatmap is probably the most screenshotted and least used piece of market data in India. Green boxes on top, red boxes at the bottom, and a trader concluding "IT is strong today, let me buy an IT breakout." That conclusion skips every step that actually matters.
Here is a small detail worth noticing. One of the popular sector analysis pages carried a data stamp of 25 Sep 2026, 06:01 AM IST. That is over three hours before the NSE opens. Whatever colours were on that grid were yesterday's close, not today's tape. If your workflow treats a pre-open heatmap as "today's sector performance," you are already trading a stale variable and calling it context.
This post is about fixing that. Not by predicting which sector leads next, but by converting sector and breadth data into timestamped inputs that a rule-based system can actually consume — and knowing when the input is too noisy to use at all.
The heatmap is a driver map, not a leaderboard
Sector rotation is usually taught as a cycle: cyclicals lead early, defensives lead late. That framework is fine as a heuristic, but it explains far less of an Indian trading day than traders assume.
A more useful read, and one the sector-analysis research itself points to, is that several NSE sectors are better understood by what they react to than by where they sit in a cycle. Bank, Realty and Auto are rate-sensitive and move on RBI policy and interest-rate expectations. IT, Metal and Pharma take cues from outside India — US technology budgets and the rupee for IT, global commodity prices and China for Metal, US regulatory action for Pharma. FMCG and agri-linked names carry monsoon and rural demand sensitivity. Energy, Auto and paints-heavy names carry crude sensitivity.
Read that way, the heatmap stops being a ranking and becomes a diagnostic. If Metal and IT are the only green boxes and everything domestic is flat, that is not "the market is strong." That is an offshore-driven move with thin domestic participation, and it has a different failure mode than a broad-based up day.
| Sector block | Primary driver | What to check before using it as context |
|---|---|---|
| Bank, Realty, Auto | RBI policy, rate expectations | Policy calendar, bond yields, whether the move is pre- or post-event |
| IT, Pharma | USD/INR, US tech spend, US regulatory action | Rupee move, overnight US close, single-stock news risk |
| Metal | Global commodity prices, China data | Overnight commodity moves, whether the sector is following or leading |
| FMCG, agri-linked | Monsoon, rural demand, input costs | Seasonal data flow, low-beta behaviour vs index |
| Energy, Auto, paints | Crude | Crude move overnight, direction of pass-through |
The practical value is asymmetric. You will rarely turn this table into an entry signal. You will regularly use it to explain away a signal — "this breakout is in an offshore-driven sector on a day the rupee moved, and my strategy was never built for that."
Breadth answers the question the heatmap cannot
A sector grid tells you which buckets moved. It does not tell you how many stocks participated. A 100-point Nifty move carried by three heavyweights and a 100-point move carried by 800 advancing stocks look identical on a price chart and behave very differently the following week.
The breadth variables worth logging daily are unglamorous and stable:
- Advancing versus declining counts on your tradable universe, not the full 2,000-plus list
- Percentage of stocks above the 10, 20 and 50-day moving averages
- New 52-week highs versus new 52-week lows
- India VIX level and, more importantly, its day-on-day change
- Distribution-day style counts — sessions where the index closes lower on higher volume than the previous day, commonly read as institutional selling pressure
None of these are signals on their own. Together they give you a participation read: is the rally broad or hollow? Narrow leadership can mark a move that is less widely supported. A broadly positive grid can coincide with stronger risk appetite. Neither is a guarantee of what comes next, and treating them as one is how traders end up over-sized on a day the tape was thinner than the index suggested.
Divergence is the part to write down
The single most useful breadth observation is a divergence: index up, declines outnumbering advances, percentage above the 20-DMA falling. When that shows up, most intraday continuation strategies are operating in a regime they were probably not backtested on.
You do not need to act on divergence. You need to record it, so that six months later you can bucket your live results by regime and see whether your system actually survives narrow tape.
Snapshot versus series: the bug most traders never find
Here is where sector data quietly breaks algo workflows.
Sector dashboards are built for human eyeballs. One free tracker refreshes every two minutes during market hours. Another publishes a rotation scan only after the close. A third shows relative strength over three months. These are three different data objects, and traders routinely mix them inside one decision.
If you want sector context in a rule, three things are non-negotiable:
Timestamp every read. Store the fetch time alongside the value. "Nifty IT was the top sector" is meaningless. "Nifty IT was the top sector as of 10:47 IST" is a feature. Without it you cannot tell a live reading from a stale one.
Never let a post-close value into an intraday rule. After-close rotation ranks, weekly relative strength versus Nifty 500, "percentage of setups bullish" — all of these are computed with information your 10:15 AM entry did not have. Using them in a backtest is straightforward look-ahead bias, and it inflates results in exactly the way that feels most convincing.
Decide the refresh cadence your rule needs, then match it. A day-level regime filter can use yesterday's close. A 3-minute continuation filter cannot. If your data source updates every two minutes and your strategy trades a 1-minute structure, the sector filter is lagging your entry by design. That may still be acceptable — just make it a stated assumption, not an accident.
This is also why a heatmap fetched at 06:01 IST is dangerous rather than merely useless. It looks current. It is labelled "today." It is yesterday.
Rotation states, and what they are allowed to do
Some rotation dashboards classify sectors into Leading, Improving, Weakening and Lagging, and track rank changes such as a sector moving from #6 to #4 between scans. This is a genuinely useful compression of relative strength — as long as you keep it in its lane.
A reasonable use: as a gate. Only take long continuation signals in sectors currently in Leading or Improving states, and log how many signals that gate removed. If the gate removes 40% of your signals and improves nothing in the results, you have learned that your edge was never sector-dependent. That is a real finding.
An unreasonable use: as an entry. A sector moving from rank 6 to rank 4 is a relative measure over a lookback window, computed on closes, on a universe that may include SME and newly listed names with thin liquidity. It says nothing about whether a specific stock's 3-minute structure is valid right now.
Rank changes are also unstable near the middle of the table. The gap between rank 5 and rank 6 is often noise. If your rule behaves differently at rank 4 versus rank 5, it is fitted to ordering artefacts. Prefer thresholds on the underlying measure — relative performance versus the index, percentage of constituents above a moving average — over the rank itself.
Building the filter, and then testing whether it earns its place
The honest sequence is: form the hypothesis, encode it, test it on your own universe, keep it only if it survives.
Some filter shapes that are cheap to test:
- Participation gate. Skip new intraday longs when the percentage of your universe above the 20-DMA is below a chosen level. Start somewhere near under 40% and let the data move it.
- Concentration gate. If only one or two sectors are green and the rest are flat or red, reduce position count rather than blocking trades. Narrow does not mean wrong; it means less confirmation.
- Volatility change gate. Use India VIX day-on-day change, not the absolute level. A level of 12 tells you little. A 15% single-day jump in VIX tells you the option pricing environment your strategy was tuned on has shifted.
- Driver-conflict gate. When your signal sits in a globally-driven sector and the overnight offshore cue points the other way, treat it as lower conviction. Conflicting triggers are a sizing question, not a directional forecast.
- Institutional pressure counter. Track distribution-day counts over a rolling window. Use them to scale exposure, not to call tops.
Every one of these needs to be run through backtesting against a no-filter baseline before it enters a live system. A filter that reduces drawdown but also cuts your trade count by 70% may leave you with a statistically meaningless sample. That trade-off has to be measured, and the only way to measure it is to build both versions in a strategy builder and compare them on the same period.
The failure mode here is filter stacking. Add a breadth gate, a sector gate, a VIX gate and a crude gate, and you will produce a beautiful equity curve on 40 trades. That is not a system. That is a curve fitted to a specific year.
Where sector context sits in a working day
Order matters. Sector and breadth context belongs before signal selection and before sizing — never after a signal has already caught your attention, because by then it is rationalisation.
A workable sequence:
- Pre-open: read yesterday's close honestly as yesterday's close. Note the sector blocks that are carrying the tape and the events on the calendar for the week.
- Post-open: let the first 15 to 30 minutes establish an intraday breadth read before enabling discretionary additions.
- Signal stage: run the scanner as usual, but apply the sector or participation gate to the candidate list rather than to individual charts.
- Validation stage: for F&O routes, check the option chain for liquidity, spread and Greeks before assuming the stock-level view translates cleanly to a strike.
- Sizing stage: apply risk management rules — daily loss limit, per-trade cap, maximum concurrent positions — with the regime read as an input to position count.
- Post-close: log the regime variables alongside each trade. This is the step almost everyone skips, and it is the only one that compounds.
In Anadi Algo, the index cards and sector heatmap on the Indices page exist for step 1 and 2 — market context before action, not a prediction engine. Screener signals feed Action Center, which ranks candidates and surfaces blocked reasons such as chase distance or invalidated price, plus F&O eligibility, VWAP gate, basis, OI pulse and PCR context. The Options workspace then carries chain inspection, basket preview and margin estimate in one flow, so risk shows up before execution rather than after it. The weekly market outlook is meant to be used the same way — as preparation, not as a signal to chase.
If you want to test this sequence on your own universe with paper trading before committing capital, you can request early access and build the filter layer first, strategies second.
Checklist: sector and breadth hygiene
- Is every sector or breadth value in my system timestamped?
- Am I using any post-close value inside an intraday rule? If yes, that is look-ahead bias.
- Does my data source's refresh cadence match the timeframe I trade?
- Have I classified my sectors by driver — rate-sensitive, globally driven, domestic demand — rather than only by cycle position?
- Do I know today's breadth read before I look at my first signal, or after?
- Is my sector filter a gate on candidate lists, or has it crept into becoming an entry trigger?
- Did I backtest the filter against a no-filter baseline, and did the trade count stay large enough to mean anything?
- Am I logging regime variables per trade so I can bucket live results by tape quality later?
- When drivers conflict, does my system reduce size, or does it still take full size and hope?
- Have I written down what I will do on event days, before the event day arrives?
Sector rotation and breadth will not tell you what the market does next. Used carefully, they tell you something more useful: whether today's tape resembles the tape your system was built for. That is a process question, and it has an answer.