Search "Bank Nifty option chain" today and you will land on a dozen live pages — NSE's own chain, broker terminals, aggregator sites — all showing the same grid: strikes down the middle, calls on one side, puts on the other, with open interest, implied volatility, Greeks, and last traded prices refreshing in front of you.
For a discretionary trader, that page is a sentiment read. For an algo trader, it is something more dangerous: a data source that looks machine-ready but is not. The numbers arrive at different speeds, some are computed rather than observed, and their meaning changes depending on where you are in the expiry cycle.
This post is about that gap. As of early September 2026, with the Bank Nifty monthly series still weeks from expiry, here is what a live chain actually gives you, what changes at this point in the cycle, and the checks worth running before any chain number touches a live rule.
What a live option chain page actually shows
Every chain page mixes three different kinds of data, and an algo should treat them differently.
Traded facts. Last traded price and volume are records of things that happened. They are reliable but can be stale — at an illiquid strike, the LTP might be many minutes old while the underlying has moved. The current bid-ask is closer to tradeable reality than the last print, and the width of that spread is your real cost of entry and exit.
Positioning data. Open interest and change in OI describe outstanding contracts. On public pages, OI updates on an interval, not tick by tick — so the "OI wall" you see is always slightly behind the market. More importantly, total OI mixes fresh positioning with carried positions from days ago. Purana OI, aaj ka bhaav — the two don't always tell the same story. Intraday change in OI isolates what is being built now, which is why most serious chain-reading focuses there rather than on raw totals.
Computed values. Implied volatility is not observed anywhere; it is backed out of prices using a model and a set of inputs — interest rate, time convention, sometimes dividend assumptions. Two websites can show different IVs for the same strike at the same moment because their inputs differ. Every Greek on the page inherits this: delta, gamma, theta, and vega are model outputs, not market facts.
None of this makes chain pages useless. It makes them decision support built for human eyes. An algo consuming the same information needs a defined snapshot source, timestamps, and consistency — which is a process problem before it is a strategy problem.
Early September context: a young monthly series
Bank Nifty contracts run on a monthly expiry cycle, so on September 3 the front-month series still has most of its life ahead of it. That changes how every column on the chain should be read. (Expiry-day conventions have shifted more than once over the past two years — verify the exact date on the NSE calendar rather than relying on memory or an old backtest config.)
OI walls are immature. The heavy call strike everyone calls "resistance" and the heavy put strike everyone calls "support" carry more meaning when a series is mature and positioning has had time to settle. Early in the cycle, those walls are still being built, and a single large writer entering or exiting can redraw the picture in an afternoon. Watching how OI shifts across a few sessions tells you more than any single day's totals.
The Greeks profile is different. Weeks from expiry, at-the-money gamma is modest, theta decays slowly, and vega is comparatively large. Rules designed for expiry week — tight gamma caps, aggressive theta-capture assumptions — do not transfer to this part of the cycle. A premium-selling module that made sense in the final week is mostly a vega position right now, whether the trader intends that or not.
The weekly rhythm still exists — one index over. Nifty runs weekly expiries on Tuesdays, so index option flows have a weekly pulse even when Bank Nifty is mid-cycle. If your system trades both underlyings, their risk states are not synchronized, and treating them with one shared expiry logic is a quiet source of bugs.
And to be clear about what this section is not: no view on where banks go this week. Whether the tape is led by financials or dragged by them, whether volatility drifts up or bleeds off, the job is the same — classify the current state and let rules respond to it, not forecast the next one.
From chain readings to machine-checkable risk states
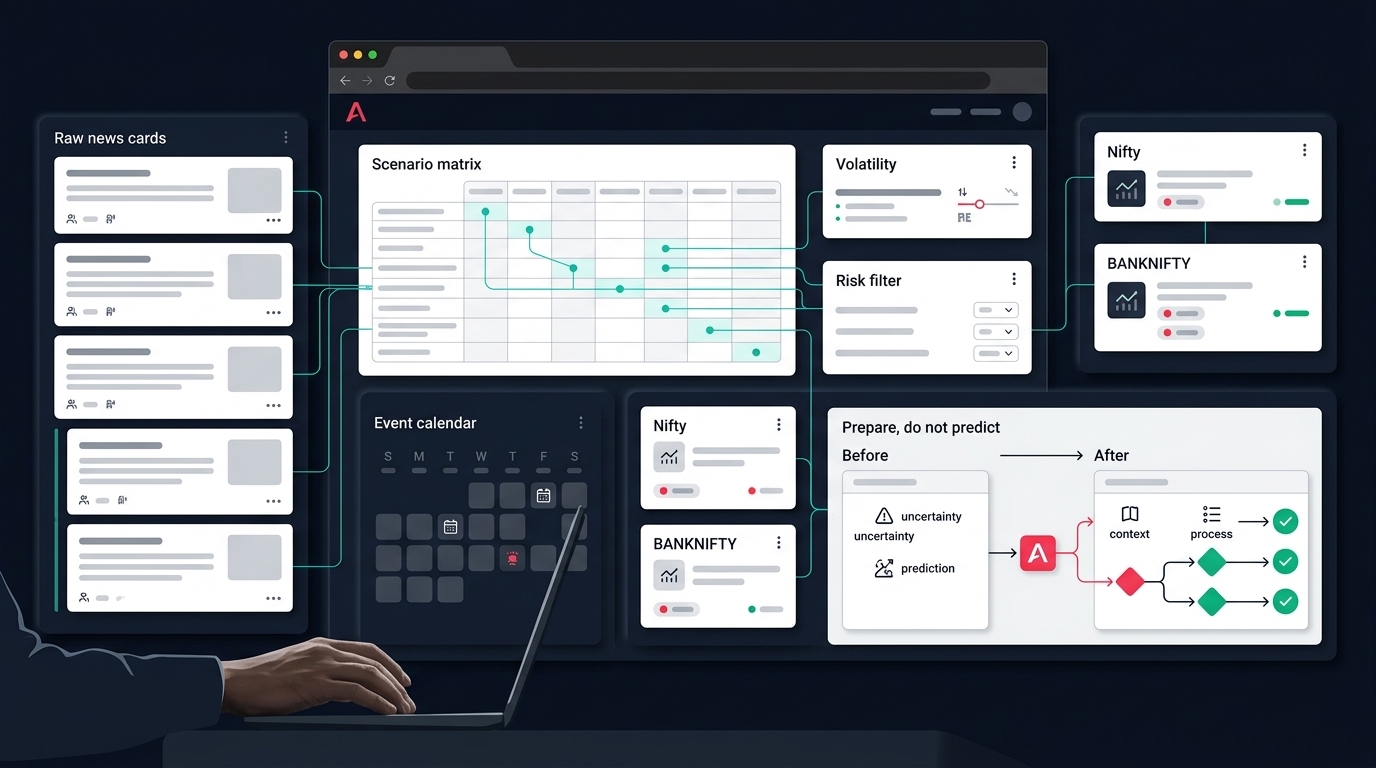
An algo cannot act on "OI looks heavy near 57,000." It can act on defined, testable states. The practical move is to convert chain observations into gates that answer allow, reduce, or stand down — before any entry logic runs.
Some examples of how that translation looks:
- Liquidity gate. Trade only strikes where the bid-ask spread is under a fixed percentage of the premium and quotes exist on both sides. This single filter removes most of the strikes a chain page displays.
- Freshness gate. If your chain snapshot is older than a defined number of minutes, the system stands down rather than acting on stale positioning data.
- IV band. Compare current at-the-money IV against its own recent range rather than judging the raw number. A premium-selling module might only be allowed inside a defined band; when IV sits well above its range, long-option ideas face a double hurdle — the move must overcome both direction risk and eventual volatility decay.
- PCR as a regime flag, not a trigger. Put-call ratio is noisy at the extremes and mean-reverting in between. Wide bands that classify the environment are defensible; a threshold that fires entries is curve-fitting waiting to happen.
- OI-shift check. Require that fresh OI is building at a strike within the session before treating it as meaningful, instead of reacting to carried positions.
Each gate maps to a position-size decision against a fixed risk budget. That is the boring, durable part of chain analysis — and it is precisely the part a risk management framework should own, not individual strategy code.
Greeks as a risk budget, not a prediction
The Greeks columns on a live chain tempt traders into using them as signals. They work better as a budget.
Delta matters at the basket level, not the leg level. A multi-leg Bank Nifty structure has one net delta, and capping that number caps directional exposure regardless of how clever the structure looks strike by strike.
Gamma is a function of days to expiry. Mid-cycle, it is forgiving; near expiry, it is not. A rule that keys gamma limits to days-to-expiry ages gracefully across the month. A static limit does not.
Theta is a cost meter for buyers and an income assumption for sellers — one that only pays out if gamma and vega don't take it back first. Selling options this far from expiry earns theta slowly while carrying meaningful vega, which is worth stating explicitly in any strategy note.
Vega deserves its own check on event days. A structure that is comfortably within its delta and theta budget can still be one volatility spike away from its stop.
The workflow point: Greeks and margin belong before execution, in the same place the structure is built. This is how Anadi's options workspace is laid out — the option chain, OI analysis, and IV and theta context sit as tabs beside strategy selection, and a basket preview estimates margin with existing positions considered, so the risk picture is visible before the order exists rather than after. Whatever structure logic you settle on, define it in a BANKNIFTY strategy builder and put it through honest options backtesting with realistic spread and slippage assumptions — mid-cycle fills are not expiry-week fills, and a backtest that ignores that difference flatters itself.
Data-quality checks before the chain feeds an algo
If chain data is going to drive automated decisions, it needs the same discipline as any other production input.
Timestamp everything. Every snapshot your system consumes should carry its capture time, and every rule that fires should log which snapshot it fired on. Without this, you cannot reconcile a live trade with a backtest, and every post-mortem turns into guesswork.
Pick one canonical source. Broker APIs and public chain pages occasionally disagree on OI or IV because of update timing and model differences. Choose one source as truth, and alert on divergence instead of silently averaging. If you are pulling data through a broker API, know its update cadence and its failure modes — session expiry and silent stale feeds cause more live losses than bad strategy logic.
Handle gaps explicitly. A missing strike row is not the same as zero OI. A feed hiccup is not the same as positioning unwinding. Systems that cannot tell these apart will eventually act on an absence of data as if it were information.
Respect session edges. Pre-open, the first minutes after 9:15, and the closing window all produce prints that distort IV and Greeks. Blackout windows around these periods cost little and prevent a lot.
A workflow that survives contact with live markets
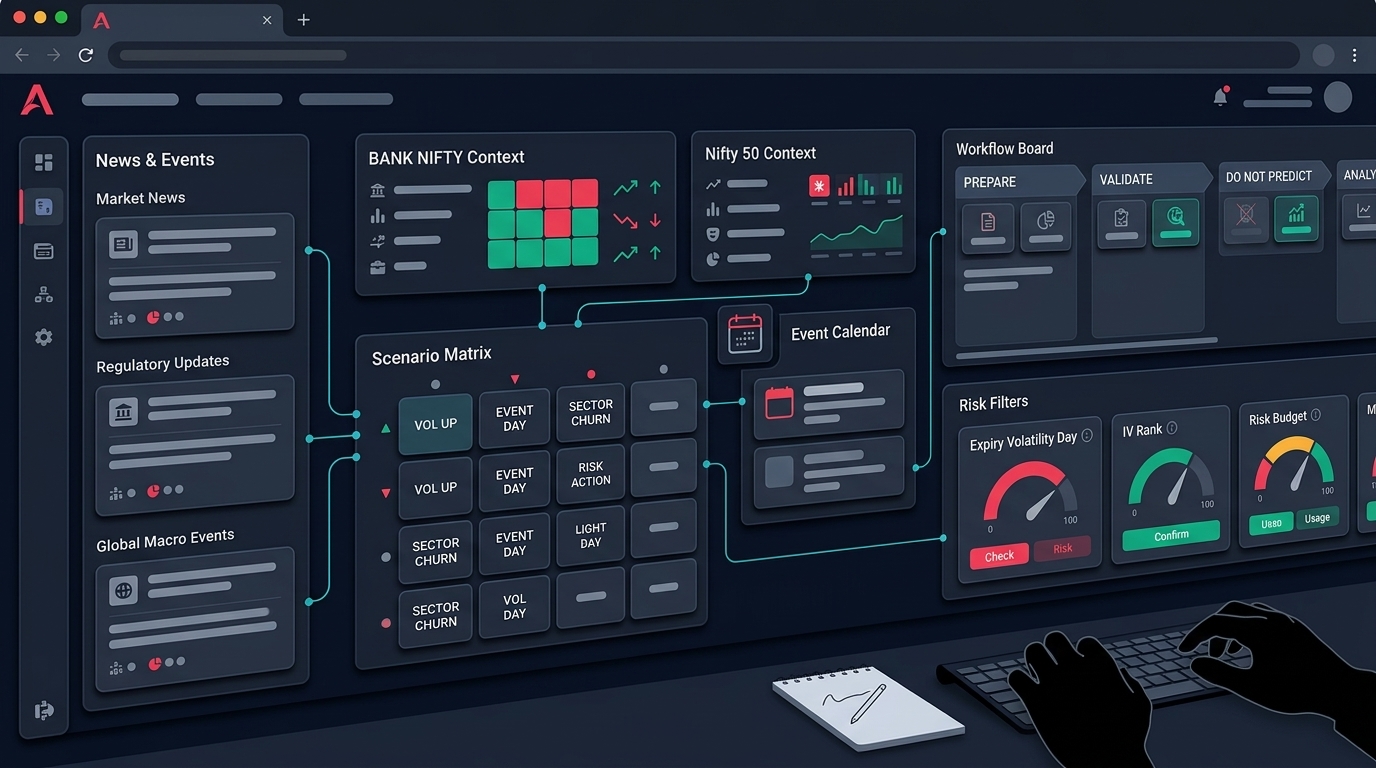
Put together, the sequence looks less like chain-gazing and more like a pipeline. Market context comes first — index and sector breadth, so a Bank Nifty idea is not fighting the broader tape. A signal source such as a scanner proposes candidates. The chain then serves as a validation step: liquidity, freshness, IV state, and OI behaviour either pass the idea through or block it. Structure selection happens with IV and theta context in view, margin and risk budget are checked before execution, and position follow-up runs on the same data discipline as entry.
Event preparation wraps around all of it. A weekly market outlook review — expiry dates, policy meetings, known data releases — exists so the calendar is handled by preparation, not by reacting to noisy intraday calls.
If you want this kind of chain-to-execution workflow in one place — chain inspection, IV and theta context, basket preview with margin, and risk gates before orders — you can request early access to Anadi Algo and pressure-test your own checklist against it.
Takeaway checklist
Before any Bank Nifty chain number drives a live rule this month:
- Know your snapshot: source, update interval, and timestamp on every read.
- Treat LTP at illiquid strikes as history; use bid-ask mid and spread width.
- Weight intraday change in OI over total OI, especially early in a monthly series.
- Read IV against its own recent range, not as a raw number.
- Key gamma and theta assumptions to days-to-expiry, not fixed values.
- Cap net delta and check vega at the basket level before execution.
- Gate entries on liquidity, freshness, and IV state — allow, reduce, or stand down.
- Define blackout windows around the open, close, and known event slots.
- Log the exact snapshot behind every fired rule so live and backtest reconcile.
- Verify expiry dates on the exchange calendar instead of assuming last month's schedule.
The live chain page is a fine place to look. The work of an algo trader is turning what it shows into states a system can check, budgets a system can enforce, and logs a system can defend. That translation — not the staring — is the edge.