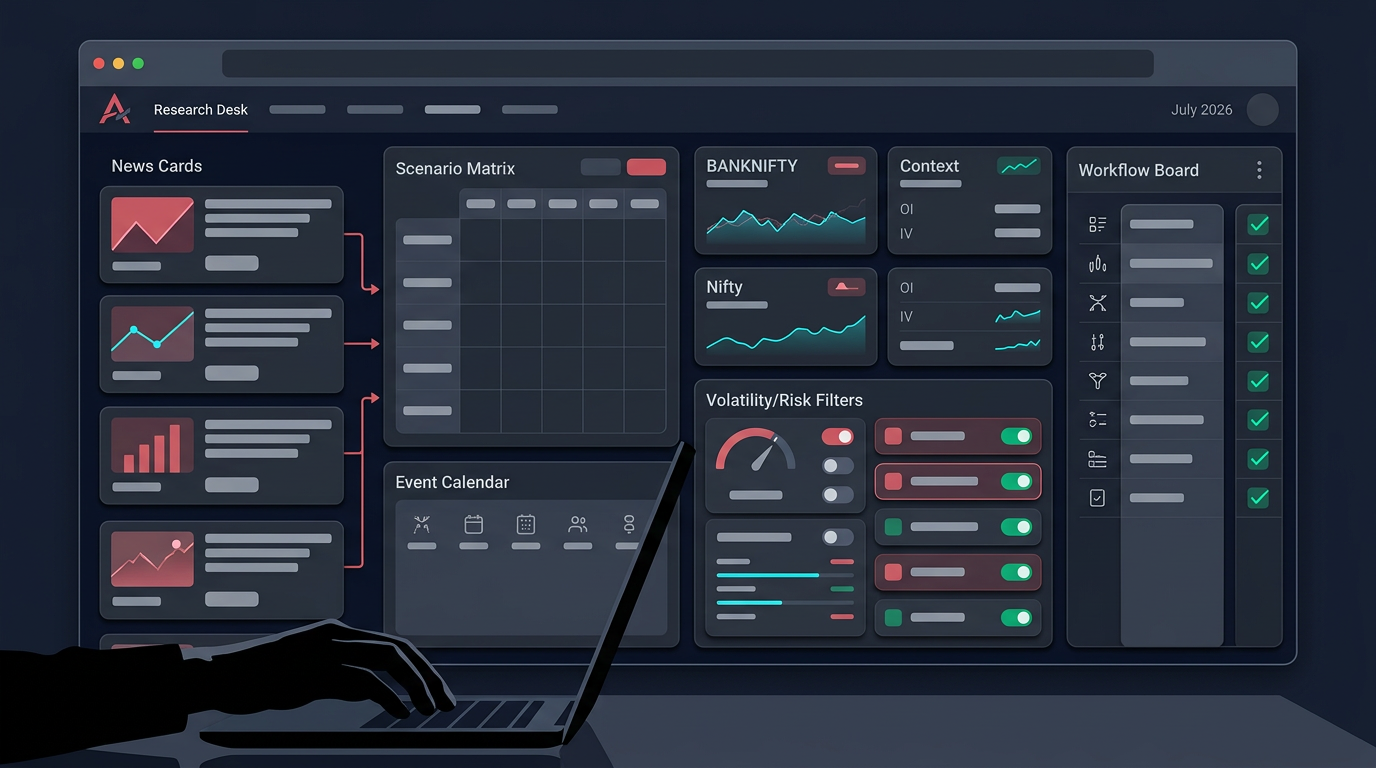
Late July 2026 has given Indian derivatives traders a specific kind of tape: index levels grinding higher, volatility readings compressed, and a monthly series that has just rolled over. Public dashboards have shown Bank Nifty around the 57,200 area with an intraday band of roughly 56,939 to 57,316, Nifty 50 near 24,250, India VIX close to 12, and a put-call ratio around 0.90.
Those are snapshots. By the time you read them they are already old. What matters for an algo trader is not the number — it is what the shape of this environment should change in your filters, your sizing, and your event blocks.
This post is a process walkthrough, not a view. No targets, no calls, no "expect a move to X". Just what to check and what to encode.
What the current readings actually tell you
Here is how a disciplined system should treat each commonly quoted number.
| Reading | Recent public value | What an algo should do with it |
|---|---|---|
| Bank Nifty spot | ~57,205, day range ~377 points | Compare to your strategy's assumed daily range; recalibrate stop distance in points, not percent |
| India VIX | ~12.01 | Treat as a regime input for position size and structure choice |
| PCR | ~0.90 | Treat as one series among many, never as a standalone trigger |
| 52-week range | ~49,955 to ~61,765 | Sanity-bound for any level your scanner produces |
| Sector contribution | Private banks up, a few small-finance names down | Breadth check before assuming an index move is broad |
Notice what is missing: any statement about direction. That is deliberate.
A label is not a signal
Several public chain pages auto-generate sentiment text — "PCR at 0.90 suggesting slightly bearish", "VIX at 12.01 indicates low expected volatility". Those labels are template output from a threshold someone chose. They are not validated features.
If your strategy reads PCR, it should read the PCR series — where today sits relative to its own 20-day distribution — not a word someone's script printed. A PCR of 0.90 means one thing in a market that has averaged 1.15 for a month and something completely different in one that has averaged 0.80.
The same applies to "support" and "resistance" pivots on those pages. Pivot points are arithmetic on yesterday's high, low, and close. They are reproducible, which is good, but they carry no edge by themselves. If you want them in a system, backtest them as a feature with the rest of your rules attached.
Low VIX changes your sizing, not your permission
An India VIX near 12 is a compressed reading. Practically, that means option premiums are thinner, the market's implied daily range is narrower, and premium-selling structures look easy on a payoff diagram.
Two things retail systems get wrong here.
First, low VIX does not mean low risk. It means the priced expectation of movement is low. Realised movement can diverge from that expectation quickly, and when it does, a short-premium book that was sized for a quiet tape takes the full gap. Compressed volatility regimes are exactly when position sizing discipline matters most, because the same lot count carries a larger multiple of the collected premium as tail exposure.
Second, low VIX compresses your reward but not your costs. If a strategy collected 90 points of premium in a higher-volatility month and collects 55 now, your slippage and brokerage did not shrink by the same proportion. Re-run your cost model. A structure that cleared costs comfortably at one premium level can be net negative at another with an identical win rate.
The Bank Nifty beta adjustment
Public research has repeatedly noted that Bank Nifty's intraday volatility tends to run roughly 1.4 to 1.6 times that of Nifty 50, driven by higher-beta and more cyclical constituents. That ratio is not a constant, but it is a useful working assumption for one specific purpose: you cannot carry the same rupee stop, the same slot count, or the same strike distance across both instruments.
A quick check worth automating: compute the trailing 20-day ratio of Bank Nifty's average true range to Nifty's, and scale your Bank Nifty lot count by the inverse. If the ratio widens, size comes down automatically. If you build in a no-code strategy builder, express this as a parameter rather than a hardcoded lot number, so the same logic survives a regime change.
The rollover phase deserves its own rules
NSE's contract specification for Bank Nifty futures defines a maximum three-month trading cycle — near month, next month, far month — with contracts expiring on the last Tuesday of the expiry period, and on the previous trading day if that Tuesday is a holiday. A new contract is introduced on the trading day after the near-month expiry.
The last Tuesday of July 2026 was 28 July. So as of today, the series has rolled and the freshly introduced far month has almost no history behind it.
That has concrete consequences for automated systems:
- Open interest resets. OI-change logic that compares against "yesterday" will read garbage across the roll boundary. Your feature should compare like-for-like within a series, not across it.
- The strike ladder repopulates. Strikes far from the new at-the-money can carry near-zero OI and wide quotes for days.
- Spreads widen where liquidity has not arrived. A basket that backtested fine on mid-prices can be unfillable at the far leg.
- Rollover flow distorts basis. Futures-versus-spot basis behaves differently during roll weeks than mid-series.
If your strategy trades multi-leg structures, add an explicit rollover-week flag and either reduce size or restrict to strikes that clear a liquidity floor. This is the kind of assumption that quietly inflates a backtest — worth reading alongside the mechanics of multi-leg basket risk before you scale up.
Read the chain as a data feed, not a picture
The single biggest gap between a manual trader and an algo trader is this: a human looks at a chain and forms an impression. A system consumes the chain as structured numbers and acts on them without judgment. That means the data quality checks have to be explicit.
Before any chain-derived value reaches a decision:
Check quote age. A stale quote on a far strike can be minutes old. If your feed exposes a last-traded timestamp, reject anything past a threshold you set — for many intraday systems, anything older than 30 seconds on a leg you intend to trade is suspect.
Check the spread as a percentage of premium. An eight-rupee spread is trivial on a 400-rupee option and fatal on a 12-rupee one. Encode the gate in percentage terms — for example, reject legs where the bid-ask spread exceeds 2 to 3 percent of the mid — rather than in absolute rupees.
Check OI units. Some sources publish open interest in contracts, others in underlying shares. If you mix sources, your OI-change feature is meaningless.
Check the contract spec against the exchange, not a mirror site. Lot size, strike interval, freeze quantity, and the applicable expiry calendar have all changed at various points. Verify from the NSE contract page for the instrument you are trading. Do not hardcode last year's values into a live system.
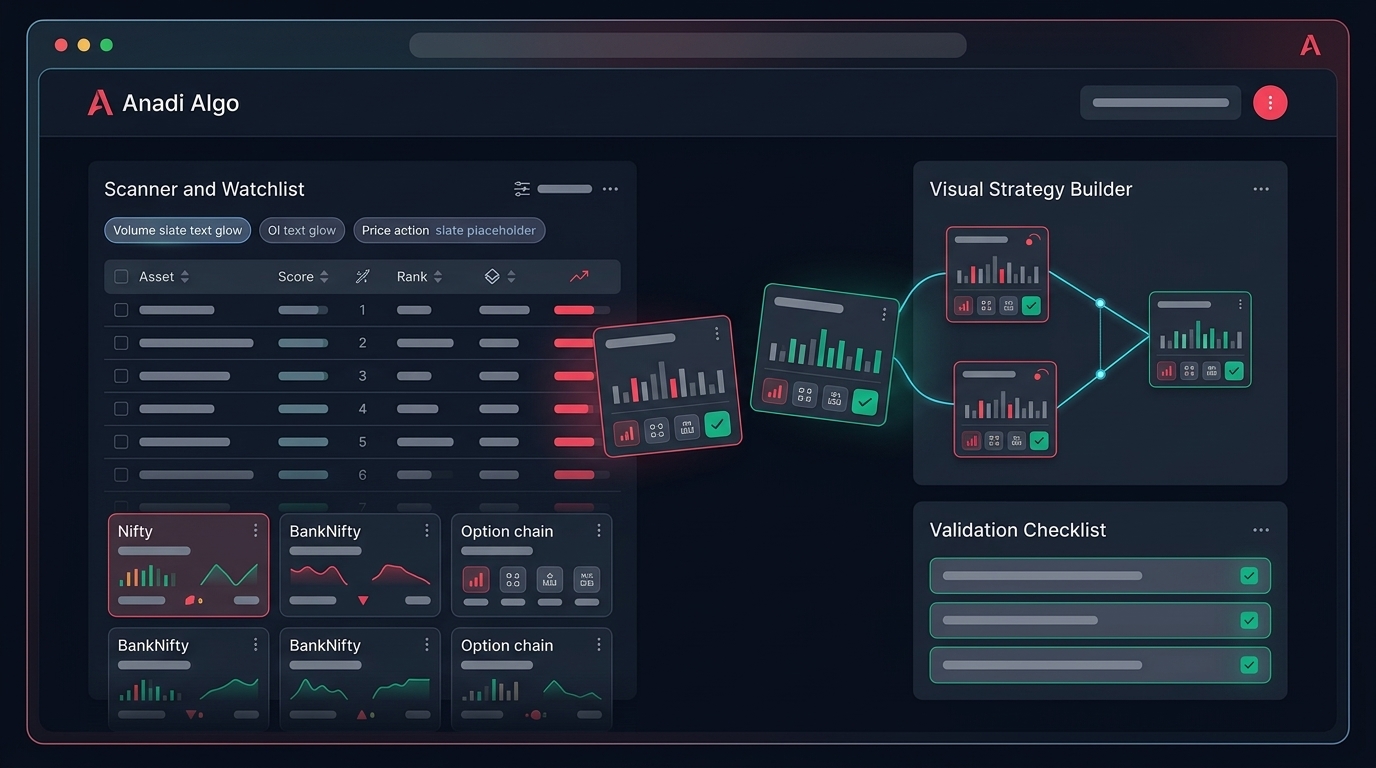
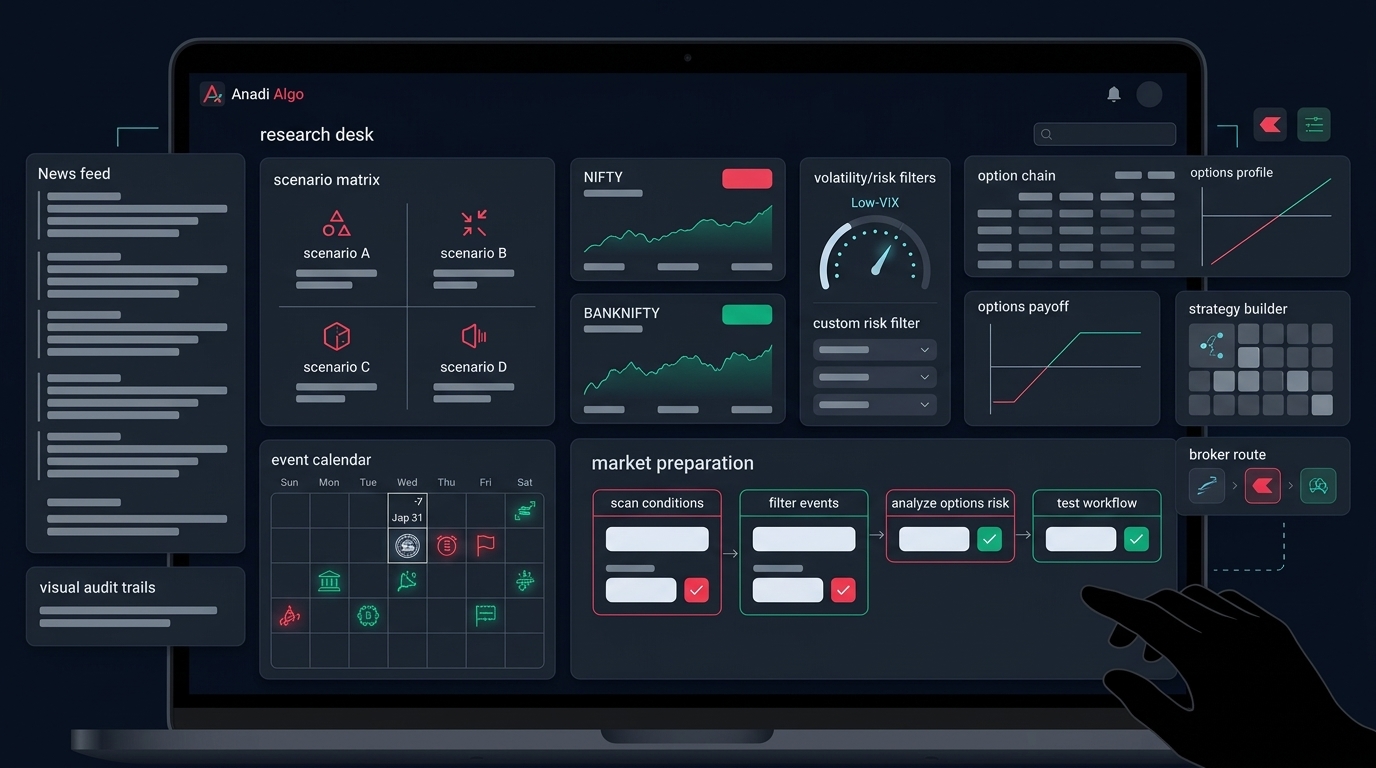
Inside Anadi, this is why the options desk at /options keeps the chain, OI analysis, IV and theta, strategy finder, hedge desk, and margin estimate in one workspace rather than scattered across tabs. You inspect the chain, build the basket, see the margin with existing positions considered, and check the risk budget before anything is sent. The point is not convenience — it is that the risk view and the execution view read from the same state.
Build an event map, then build blocks around it
Bank Nifty's sensitivity is structural: it is a concentrated basket of banks, so it reacts to RBI policy communication, banking-sector results from index heavyweights, systemic credit news, and global rate expectations more sharply than a broad index does.
You do not need to predict any of these. You need to know when they are scheduled and encode avoidance.
A workable event framework:
- Maintain a calendar from primary sources — the RBI's own announcements page for policy dates, exchange circulars for expiry and holiday changes, and company filings for results dates of the largest index constituents.
- Define a block window per event class. For example: no fresh entries from 15 minutes before to 30 minutes after a scheduled policy statement, and no new naked short-premium positions on results day for a top-weight constituent.
- Define behaviour for open positions separately from new entries. Blocking entries is easy. Deciding whether an existing position should be flattened, hedged, or held through an event is a rule you must write in advance, because you will not write it well at 2 PM with money on the line.
- Log every block. If your system skipped 14 signals last month because of event windows, you should be able to see what those 14 would have done. That is how you find out whether your filter is protective or just expensive.
This is also the honest use of market context generally. A weekly market outlook is preparation material — it tells you what is scheduled and what regime you are in. It is not a source of trade calls.
Converting all of this into executable filters
Here is the same content expressed the way a system consumes it. Numbers below are illustrative starting points, not recommendations — you must fit them to your own instrument, timeframe, and cost structure.
Regime gate. Compute VIX percentile over a trailing 60 sessions. Map percentile bands to a size multiplier and to permitted structures. Low-percentile bands might favour defined-risk structures over naked ones; high-percentile bands might reduce size outright. Backtest the mapping — do not assume it.
Liquidity gate. Reject any leg failing a minimum OI floor, a minimum traded-volume floor for the session, and the spread-percentage cap above. Run this check at signal time and again at order time.
Breadth confirmation. An index move driven by two heavyweights is not the same as one with broad sector participation. Anadi's Indices page pairs index cards with a sector heatmap for exactly this check — confirm participation before treating an index move as a regime shift.
Chase distance. If price has already travelled a defined multiple of average true range beyond your trigger level, the entry is stale. Anadi's Action Center makes this explicit: candidates carry a signal stage, freshness, and blocked reasons such as chase distance or invalidated price, so a late signal is visibly rejected rather than silently filled.
Daily loss limit. A hard rupee or percentage cap that halts new entries for the session. This is the one filter that matters in every regime. If you have not formalised it yet, start with the fundamentals of risk management before you tune anything else.
Cost model. Re-estimate slippage and brokerage at current premium levels, not at the levels your backtest was built on.
Pre-session checklist
Run this before the next session, not during it:
- Confirmed the current expiry calendar and contract spec from the exchange page, not a cached copy.
- Verified lot size and freeze quantity for every instrument in the strategy.
- Confirmed OI features handle the series roll correctly and are not comparing across contracts.
- Recomputed the VIX percentile band and applied the corresponding size multiplier.
- Recomputed the Bank Nifty to Nifty volatility ratio and adjusted relative sizing.
- Re-ran the cost model at today's premium levels.
- Liquidity and spread gates active on every leg, checked twice — at signal and at order.
- Event calendar loaded for the next 10 sessions, with block windows defined.
- Daily loss limit configured and tested, including what happens to open positions when it triggers.
- Broker session token validity confirmed — an expired session at 9:15 is a risk event, not an inconvenience.
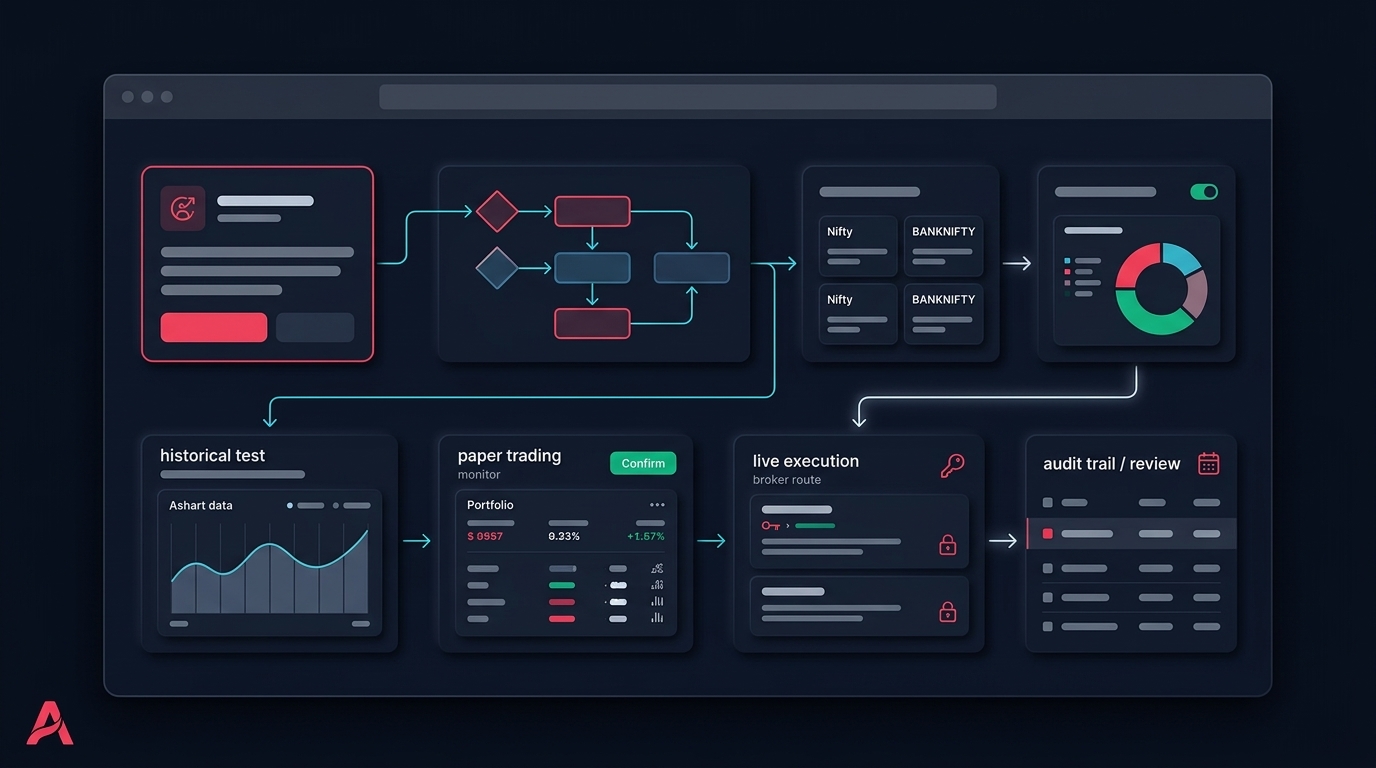
If you want to build these filters as testable rules rather than mental notes, you can start with early access and wire the chain, scanner, and risk checks into one workflow before anything goes live.
The takeaway
A compressed-volatility tape in a freshly rolled series is not inherently safe or dangerous. It is simply a set of conditions with known effects: thinner premium, narrower implied ranges, unreliable cross-series OI comparisons, and liquidity that has not yet settled into the new strike ladder.
Your job is not to guess where Bank Nifty goes from 57,200. It is to make sure that when your system reads the chain tomorrow morning, every number it consumes is fresh, correctly scaled, liquidity-verified, and sized for the regime it is actually in — and that it refuses to trade when any of those checks fail.