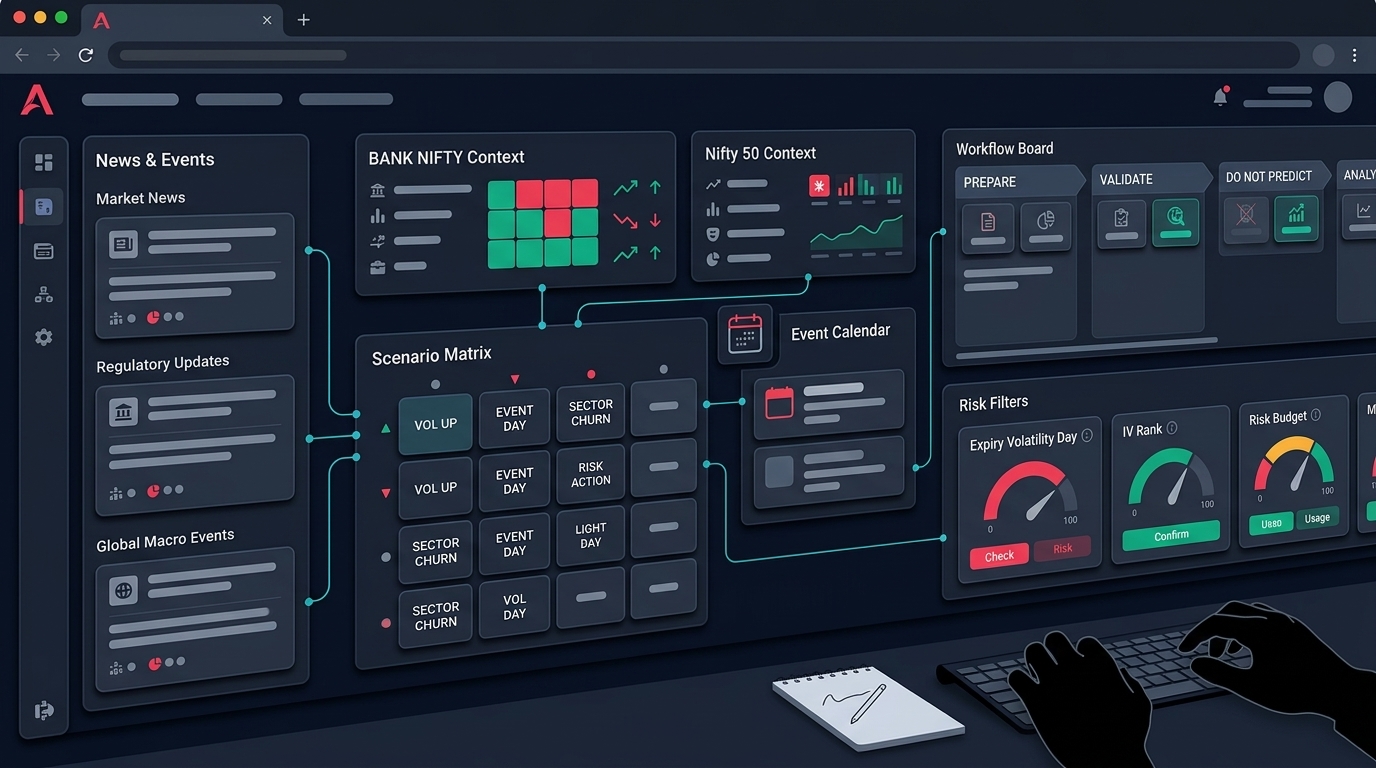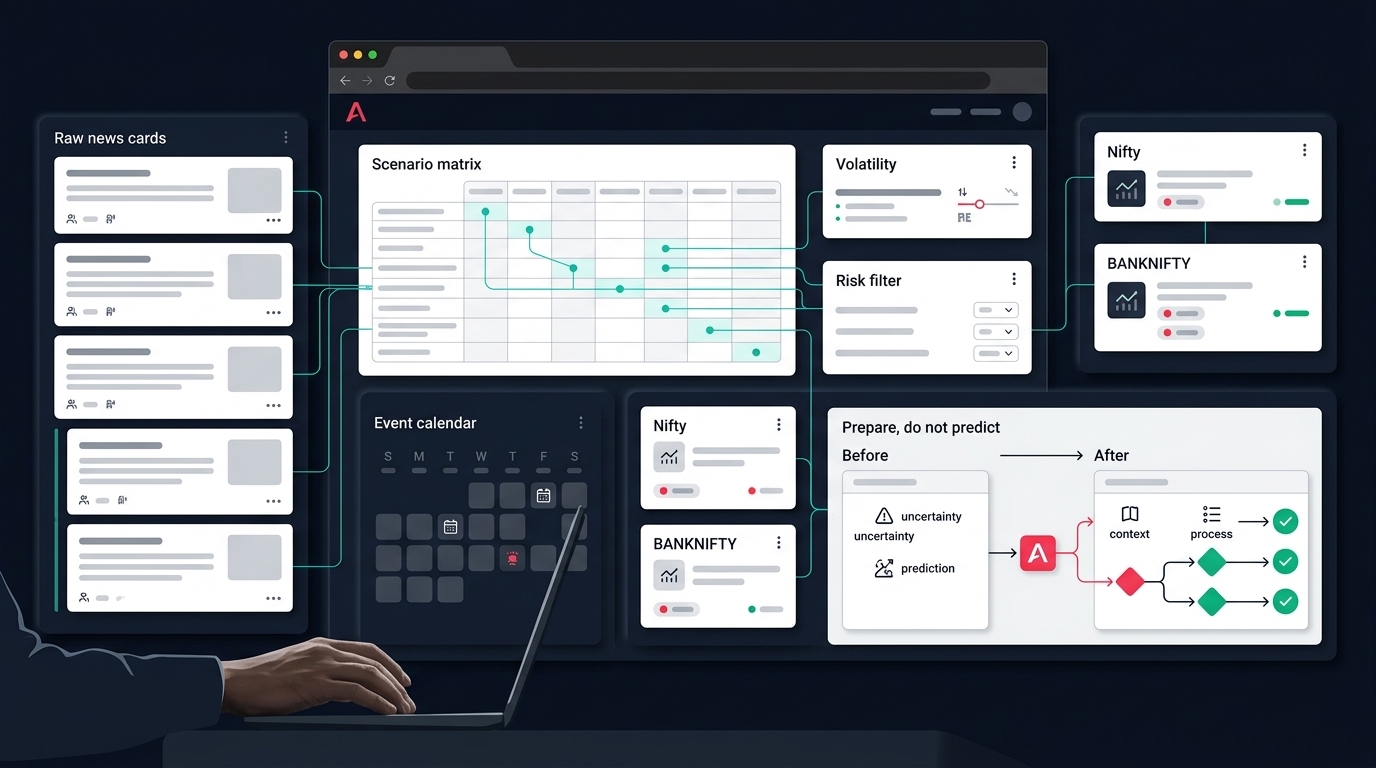
It is Tuesday, 15 September 2026. Nifty's weekly options expire today. Bank Nifty's do not — its September monthly series still has about two weeks to run, with expiry landing on the last Tuesday of the month. Yet if you open any live Bank Nifty option chain page right now, it will look busy: OI shifting, IV ticking, Greeks updating every few seconds.
This creates a specific confusion for algo traders. The chain looks like it is telling you something urgent, but the urgency belongs to a different index's expiry. Reading a Bank Nifty chain mid-series requires a different lens than reading it on expiry day — and most retail filters quietly assume expiry-week behaviour all the time.
This post is about that lens: what the live chain actually shows, how mid-series Greeks should be interpreted, how a Nifty expiry Tuesday bleeds into the Bank Nifty tape, and how to turn all of it into risk filters your system can enforce. No predictions, no trade calls — only process.
Where the September series clock stands
Since the exchange moved index expiries to Tuesdays, the weekly rhythm of Indian derivatives changed shape. Nifty trades weekly and monthly expiries on Tuesday. Bank Nifty runs on a monthly cycle only, so on most Tuesdays — including today — the expiry pressure sits entirely in Nifty.
That makes "days to expiry" one of the most underused variables in retail algo trading. A Bank Nifty chain with 14 days left behaves differently from the same chain with 2 days left:
- Premiums carry meaningful time value, so option sellers are not yet in the aggressive pin-defence mode you see near expiry.
- OI at far strikes can be old positioning rather than an active battle line.
- Intraday moves get absorbed by time value instead of translating directly into option P&L.
Most traders know this loosely. Few encode it. If your strategy file has no notion of where it sits in the expiry cycle, it will apply the same entry logic on 15 September that it applies on 29 September — and those are different markets wearing the same symbol.
What a live chain page shows — and what it leaves out
The popular live chain pages — NSE's own option chain, broker and portal versions — all present the same core grid: calls on the left, puts on the right, strikes down the middle, with open interest, change in OI, implied volatility, and last traded price as the working columns. NSE's page adds a CSV download and a streaming on/off toggle.
The four columns that do most of the work
For discretionary reading, four columns carry most of the information:
- Highest call OI marks where option writers are selling most aggressively — the market's working resistance for that expiry.
- Highest put OI marks the same on the downside — working support.
- Change in OI separates fresh positioning from stale carry. A strike adding OI today matters more than one holding month-old positions, and mid-series chains carry a lot of stale weight.
- IV at your strike versus neighbouring strikes tells you whether you are paying inflated volatility. Buying at elevated IV means the trade must beat both direction and volatility decay.
One more check worth stealing from manual traders: compare LTP against intrinsic value at ATM strikes. Wide time premiums signal that the market is pricing movement; thin ones signal the opposite. Mid-series, premiums should be comfortably above intrinsic — if they are not, ask why before your system sells anything.
Snapshot versus system input
Here is the part that matters for automation: a live chain page is a snapshot for human eyes, not a data feed for a system. It typically lacks timestamps you control, bid-ask depth, and history. If your algo logic says "check OI support before entry," someone glancing at a webpage at 9:20 is not a check — it is a ritual.
An algo needs the same information as logged, machine-readable input: OI and IV captured at defined times, spreads measured at the moment of decision, and values validated against sanity bounds. A chain page teaches you what to look at. Your system needs the same data on its own terms.
Mid-series Greeks: same numbers, different meaning
Greeks displayed on a chain are point-in-time values. What they imply depends heavily on the series clock.
Theta and gamma two weeks out
With roughly two weeks to Bank Nifty's monthly expiry, per-day theta is smaller than expiry week but relentless — a sold option bleeds slowly, a bought option decays slowly. Gamma is muted: the underlying can move a few hundred points without option deltas swinging violently. This is why expiry-day rules — tight time cutoffs, gamma-driven position caps, last-hour exits — are the wrong template for a day like today. Applying them mid-series makes a system overly twitchy; skipping them on actual expiry days makes it dangerously calm.
Vega and the event calendar
Mid-series, vega deserves the most respect. Two weeks out, a shift in implied volatility can move option prices more than a day of decay or a modest spot move. And mid-September is usually a dense event window — global central bank meetings and domestic data prints tend to cluster in this stretch. Do not assume; check the calendar for this week specifically.
The practical mid-series questions are:
- Is IV on my traded strikes elevated or compressed relative to its own recent range, not some absolute number?
- Is there a scheduled event between now and my intended holding period that could reprice volatility against me?
- If I am selling premium, am I being paid for event risk or just collecting thin theta in front of a known catalyst?
None of these require forecasting. They require looking, and logging what you saw.
A Nifty expiry Tuesday still moves the Bank Nifty tape
Even without its own expiry, Bank Nifty rarely sits out a Nifty expiry session. The heavyweight private banks are large constituents of both indices, so expiry-driven index flows in Nifty mechanically move Bank Nifty's constituents too. Expiry pressure aaj Nifty par hai, but the tape is shared.
For process purposes, that means:
- Late-session behaviour changes. The last hour of an expiry session often carries repositioning and unwinding flows. If your Bank Nifty intraday system trades into the close, it is trading someone else's expiry mechanics.
- Chain activity can mislead. OI changes in Bank Nifty options today may reflect traders rolling or hedging cross-index structures, not a fresh directional view on banks.
- Volatility is borrowed, not owned. A sharp Nifty expiry move can spike Bank Nifty realised volatility for an hour without any banking-sector cause behind it.
The clean way to handle this is a regime tag, not a prediction: mark sessions as "own expiry," "other-index expiry," or "no expiry," and let position size, entry windows, or strategy selection read that tag. A BANKNIFTY strategy builder workflow that supports condition-based filters lets you encode this once instead of remembering it every Tuesday.
From chain reading to algo rules
The gap between "I looked at the chain" and "my system enforces a rule" is where most retail automation quietly fails. Here are filters worth encoding, each traceable to something visible on a live chain:
- Spread gate. Measure bid-ask spread on the actual strike at decision time. If the spread exceeds your threshold — as a percentage of premium, not a fixed number of rupees — skip the trade. Mid-series far strikes can be deceptively wide.
- OI wall distance, logged not worshipped. Record how far your entry strike sits from the highest call OI and put OI strikes. Do not treat walls as guarantees; treat the distance as a feature you can evaluate later in backtests.
- IV percentile against own history. Compare current IV to the last few weeks of your own logged values. "IV is 14" means nothing alone; "IV is at the bottom of its recent range in front of an event week" is a process input.
- Days-to-expiry as a first-class variable. Every entry record should carry the series-clock value for both Bank Nifty's monthly cycle and the Nifty weekly cycle running alongside it.
- Basket-level stop. Multi-leg positions need risk defined on the structure, not per leg. A leg-level stop on a hedged basket can fire on noise and leave you unhedged.
- Margin before execution. Estimate margin with existing positions considered, before the order goes out — not after a rejection.
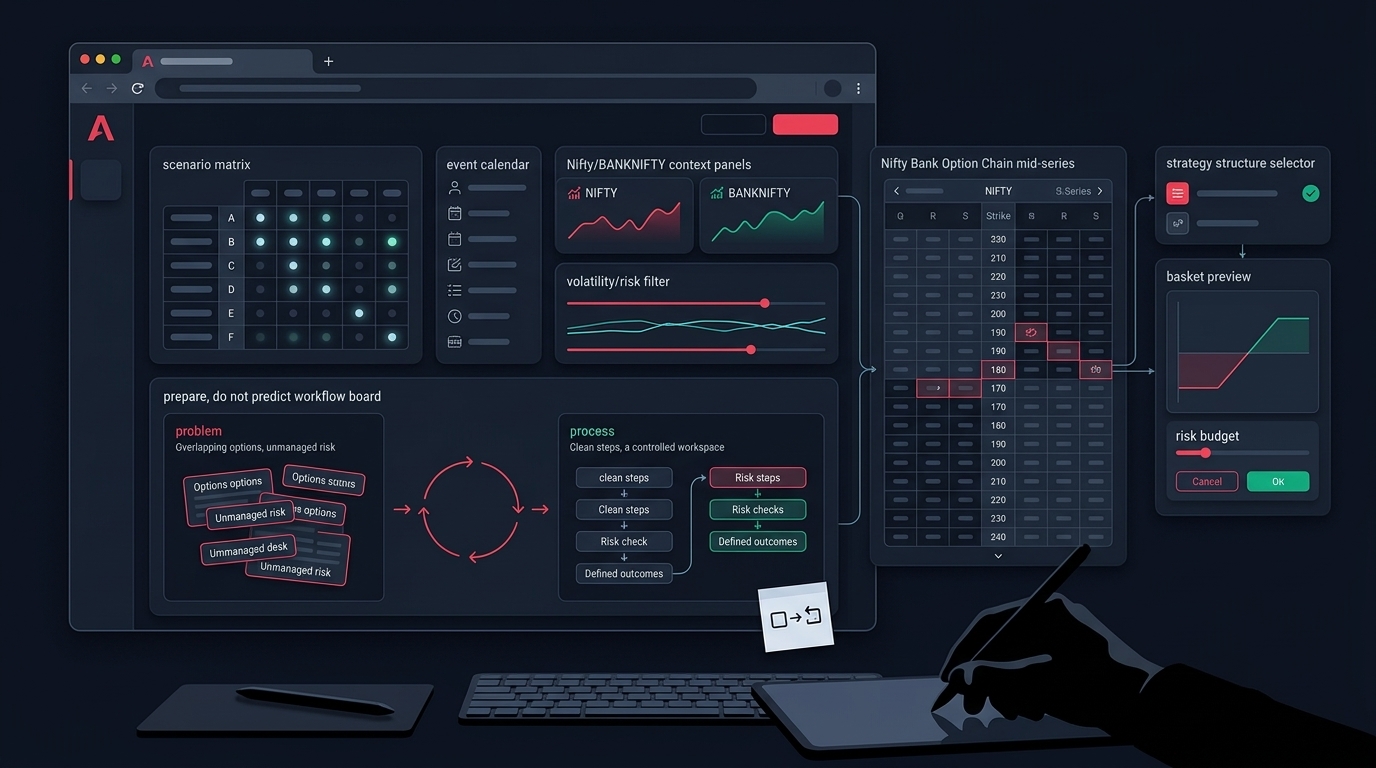
This is the workflow logic behind how Anadi's options workspace is arranged: the option chain, OI analysis, and IV & theta views sit as tabs beside strategy selection, and chain rows connect to a basket preview with a margin estimate before anything executes. The same principle applies whatever stack you use — inspection, structure, risk, and margin belong in one sequence, not four browser tabs. For stock F&O candidates, the equivalent context — OI pulse, PCR, VWAP gate, basis — is what turns a raw scanner signal into a checked decision instead of a chased one.
Backtest the series clock before you trust it
Everything above is a hypothesis until your own data supports it. The test is straightforward:
- Take your historical Bank Nifty trades — real or simulated.
- Tag each by days-to-expiry bucket: expiry day, expiry week, mid-series, series start.
- Additionally tag sessions where Nifty had a weekly expiry but Bank Nifty did not.
- Measure win rate, average slippage, stop-hit frequency, and P&L dispersion per bucket — separately.
Many traders discover that a strategy's edge concentrates in one or two buckets, and the remaining sessions merely add noise and costs. That discovery changes deployment — trade fewer sessions, size differently, or split one strategy into two — without predicting anything about tomorrow. A proper options backtesting pass with honest fills and costs is the only way to know which bucket your edge actually lives in; be careful that a small sample per bucket does not turn this into curve-fitting.
A working checklist for a week like this
Pre-open, before any system goes live:
- Whose expiry is today? Tag the session accordingly.
- What scheduled events sit between now and Bank Nifty's monthly expiry? List them; decide in advance which ones your system sits out.
- Is IV on your traded strikes high or low against your own logged range?
- Are spreads on your usual strikes within tolerance at the open, or still settling?
- Is your daily loss limit armed and your kill-switch tested? Risk management that exists only in your head does not count.
During the session:
- Watch change in OI, not total OI, for anything you treat as positioning evidence.
- If it is another index's expiry day, treat the final hour as a distinct regime — reduce, pause, or at minimum log it separately.
- If a leg fills and its partner does not, your basket rule — not your reflexes — should decide what happens next.
The Bank Nifty chain on a mid-series Tuesday is not shouting a signal. It is describing positioning, volatility pricing, and time — three inputs your process can use only if you capture them deliberately. That is the difference between watching a live page and running a system. Our weekly market outlook follows the same principle: context to prepare with, not calls to chase. And if you want to build these checks — chain inspection, IV context, basket risk, margin preview — into one workflow instead of five tabs, you can request early access to Anadi Algo and set them up before the September expiry arrives.
The takeaway: read the chain with the series clock in hand. Same columns, same Greeks — different meaning, two Tuesdays apart.