Open the NSE Bank Nifty option chain on any active session and it looks like a decision is being handed to you. Walls of call open interest above price, put open interest below, a PCR number, an implied volatility column that flickers green and red. It feels like the market is telling you where it wants to go.
It isn't. The option chain is a snapshot of positioning and pricing, not a forecast. For a discretionary trader that distinction is uncomfortable. For an algo trader it is the whole game, because you have to convert what the chain shows into rules a machine can act on without a gut feeling to fall back on.
This post is about that conversion — how to read live Bank Nifty OI, IV, and PCR as risk filters and regime context, especially around expiry and volatile sessions like the ones we have seen through mid-June 2026. No predictions, no trade calls. Just process.
What the Bank Nifty option chain actually shows
Strip the chain down and there are only a few columns that matter for system design.
- Open Interest (OI): the number of outstanding contracts at a strike. High call OI above price and high put OI below price are often read as resistance and support, but they really mark where positions are concentrated.
- Change in OI: how that positioning shifted from the previous session. This is more informative than absolute OI because it shows fresh activity.
- Implied Volatility (IV): the market's priced-in expectation of movement for that contract. It is an output of option prices, not an input you can verify against reality until later.
- PCR (Put-Call Ratio): total put OI divided by total call OI. One number meant to summarise sentiment.
- LTP and volume: last traded price and how much actually changed hands, which together tell you whether a strike is liquid enough to trade at all.
Bank Nifty is more volatile and faster-moving than most underlyings, with tighter intraday ranges that flip quickly. That makes its chain popular and also makes it easy to over-read. Every number above is real data. None of them is a signal on its own.
Why algo traders misread OI, IV, and PCR
Most bad option-chain rules come from treating descriptive data as predictive data.
OI is positioning, not direction
A heavy call OI strike is sometimes called resistance. But that OI could be written by sellers expecting price to stay below, or bought by traders expecting a breakout above. The chain does not tell you which. When price slices through a "resistance" strike with rising OI on both sides, the level did not fail — it was never a level, just a crowd. Build your logic so OI confirms a price-based setup, never so OI alone triggers an entry.
PCR is a ratio, not a signal
A PCR of 1.3 is "bullish" in countless tutorials and "overbought, so bearish" in just as many. Both interpretations exist because PCR has no fixed meaning. It only carries information relative to its own recent range and the current regime. A rising PCR into a falling market means something different from the same PCR in a quiet, range-bound week. If your strategy fires on "PCR above X," you have hardcoded a number that drifts.
IV is a regime, not a forecast
High IV does not mean a big move is coming; it means the move is already expensive to bet on. This is where directional traders quietly lose. You can be right on direction, buy an option into elevated IV, and still bleed as volatility normalises and theta does its work. For an algo, IV is best used as a state variable that decides which structure to deploy — not whether to trade direction at all.
Turning chain data into machine-readable filters
The useful move is to stop asking "what is the chain telling me to do" and start asking "what does the chain tell me NOT to do right now."
Treat IV as a regime gate
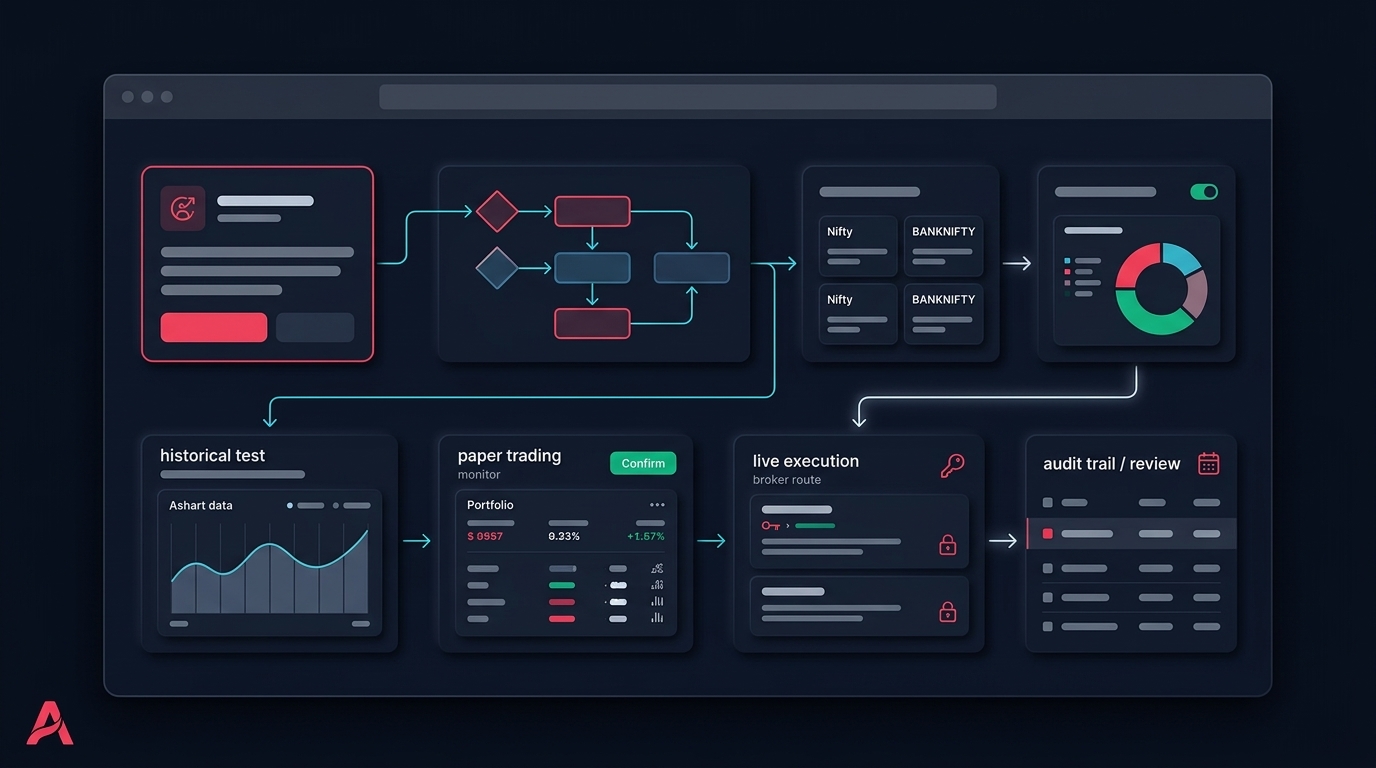
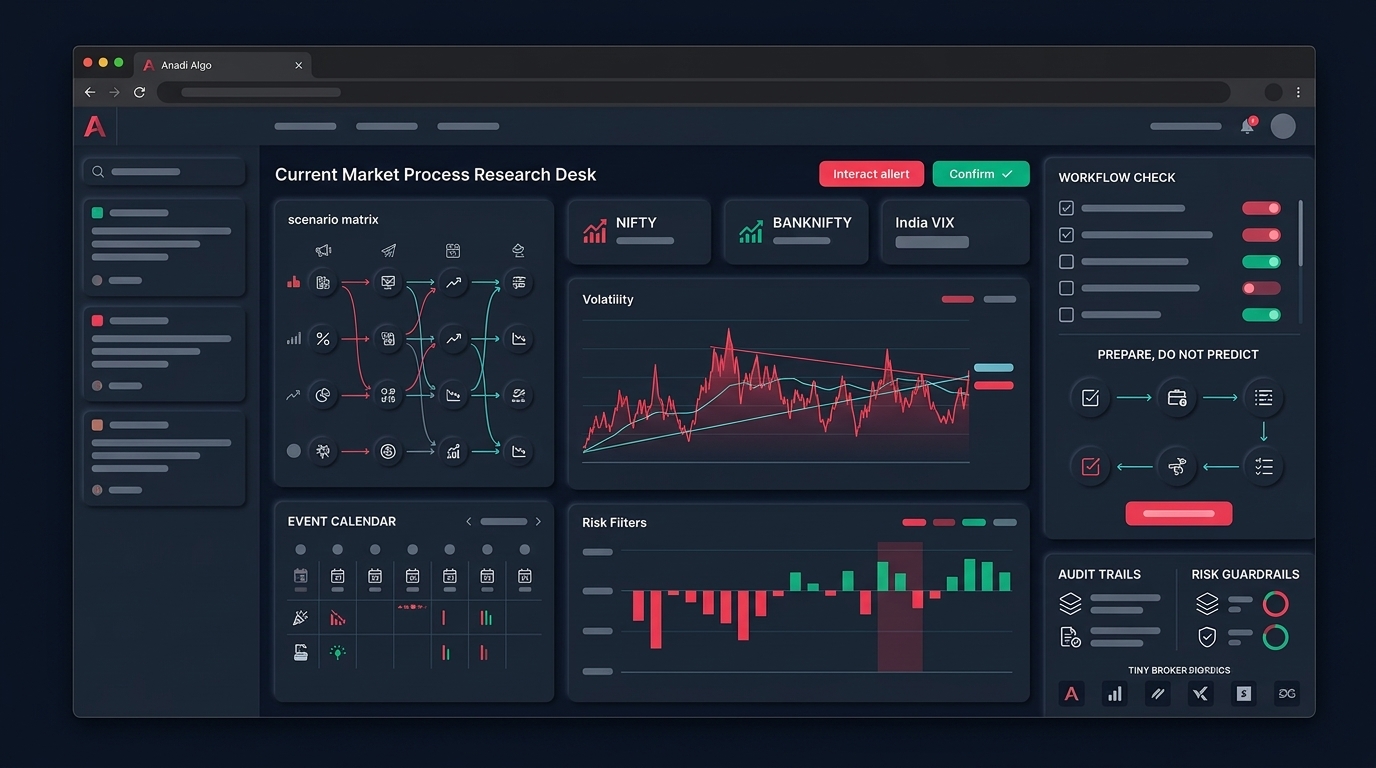
Instead of a single IV threshold, bucket it. Define low, normal, and elevated IV bands from a rolling lookback of ATM IV, and let the band decide structure. Premium-selling logic might be allowed only in elevated bands; debit structures might be preferred in low bands. The decision is mechanical and tied to current conditions, not to a number you picked once. Anadi's options workspace keeps IV and theta on a dedicated tab right beside the chain and OI views, so this context sits in front of you before execution rather than after the fill.
Use PCR bands, not absolute lines
Convert PCR into a percentile of its own recent distribution. "PCR in the top decile of the last 20 sessions" is a far more stable filter than "PCR above 1.4." It adapts as the regime shifts and stops your system from acting on a level that meant something three months ago and nothing today.
Make OI a confirmation layer
OI buildup should sit downstream of a price or structure signal, not upstream of it. A clean workflow looks like: a scanner or price condition flags a setup, then OI and change-in-OI confirm whether positioning supports it, then risk and margin are checked before anything routes to the broker. Anadi's OI Analysis tab and the F&O context in the Action Center are built for exactly this confirmation role — OI pulse, daily OI, and PCR appear alongside the candidate so the data validates a signal instead of becoming the signal.
Expiry and volatility — the part that breaks systems
The single biggest reason Bank Nifty option strategies behave differently live than in a backtest is expiry mechanics, and it is also where "today's market context" matters most.
As you move toward expiry, gamma rises sharply. Small moves in the underlying produce large, non-linear changes in option value and in your position's delta. A short-option system that looked calm all week can see its risk profile change in minutes near the close on expiry day. If your rules were tuned on calmer mid-cycle sessions, expiry is where they get tested.
Three practical consequences for an algo:
- Slippage widens. Bid-ask spreads on Bank Nifty options can blow out during fast moves and in the final expiry hour. A fill assumption that holds at 11 am may be fiction at 3 pm.
- Liquidity migrates. Volume concentrates in near-the-money strikes close to expiry. A strike that was tradable on Monday may be a wide, thin quote by Thursday.
- Event clustering hurts. Expiry sessions that overlap with scheduled events — an RBI policy day, inflation or jobs data, a major global cue — compound volatility. June 2026 has had several such overlapping sessions, and they are exactly the days a naive system should be sized down or sat out.
Two more things worth checking as a matter of process, not prediction. First, confirm the current expiry schedule and position limits for your underlying before you assume last quarter's rules still apply — exchange and broker structures around expiry have changed more than once recently, and a changed schedule is a system input, not a footnote. Second, build event avoidance directly into the code. A simple calendar gate that blocks new entries around known high-impact events removes a whole category of avoidable losses. Use a weekly market outlook to prepare that calendar, not to chase a directional call.
Data freshness is a silent killer
The free option chain you read on a website and the data your strategy acts on are often not the same thing, and the gap is dangerous.
Many public chains refresh on a delay or snapshot OI at intervals rather than streaming it. If your eyeballs are on a near-live screen but your automation is polling a slower feed — or vice versa — you can build rules around a level that has already moved. Worse, OI is finalised end of day; intraday OI is provisional and gets revised. A rule that depends on a precise OI threshold can fire on a number that is later corrected.
Practical defences:
- Know your source latency. Treat any OI or PCR value as "as of a timestamp," and make the timestamp part of the decision.
- Don't mix sources. The chart, the chain, and the execution layer should agree on where data comes from.
- Prefer change-in-OI and direction of change over exact absolute thresholds, since those survive minor data revisions better.
Backtest the filter before you trust it
Any chain-based rule — an IV regime gate, a PCR percentile filter, an OI confirmation — is a hypothesis until you test it on history with honest assumptions. This is where most option-chain ideas quietly fall apart.
Option backtesting on Indian indices is unforgiving if you cut corners. You need realistic spreads, not mid-prices; expiry-day liquidity that reflects how thin strikes really get; and slippage that scales with volatility instead of a flat per-trade number. A short-straddle or spread system that shows smooth returns on clean mid-price data can be unprofitable once expiry slippage and gap risk are modelled.
When you do test, isolate the filter. Run the base strategy with and without the IV gate, with and without the PCR band, and check whether the filter actually improves risk-adjusted outcomes or just curve-fits the sample. A filter that helps in one regime and hurts in another is not a filter — it is an opinion you backtested into looking smart. If you are building these structures on Bank Nifty specifically, a dedicated BANKNIFTY strategy builder lets you wire the chain logic and the risk management rules into the same place you test them.
A practical pre-trade checklist
Before any Bank Nifty option system trades on chain data, run through this:
- Regime first. What IV band are we in, and does the chosen structure fit it?
- PCR in context. Is PCR extreme relative to its own recent range, or just an arbitrary number?
- OI as confirmation. Does change-in-OI support the price setup, or am I letting OI lead?
- Expiry awareness. How many days to expiry, and is gamma risk priced into position size?
- Event calendar. Is there an RBI, data, or global-cue overlap today that should block new entries?
- Data sanity. Is my chain feed live enough, single-sourced, and timestamped?
- Liquidity. Are the strikes I want actually tradable at the spread I assumed?
- Tested logic. Has this exact filter been backtested with realistic slippage and expiry assumptions?
The live Bank Nifty option chain is one of the richest free data sources Indian retail traders have. It is also one of the easiest to over-trust. Used as a regime and risk filter — IV to choose structure, PCR for context, OI for confirmation, expiry for sizing — it makes an algo system more disciplined. Used as a signal generator, it mostly manufactures confidence.
If you want to build and test these chain-based filters in one workflow instead of stitching together a website, a spreadsheet, and a broker terminal, you can request early access and try it on your own rules.
Read the chain to prepare and to protect your downside. Let your tested process, not the flickering numbers, decide when to act.