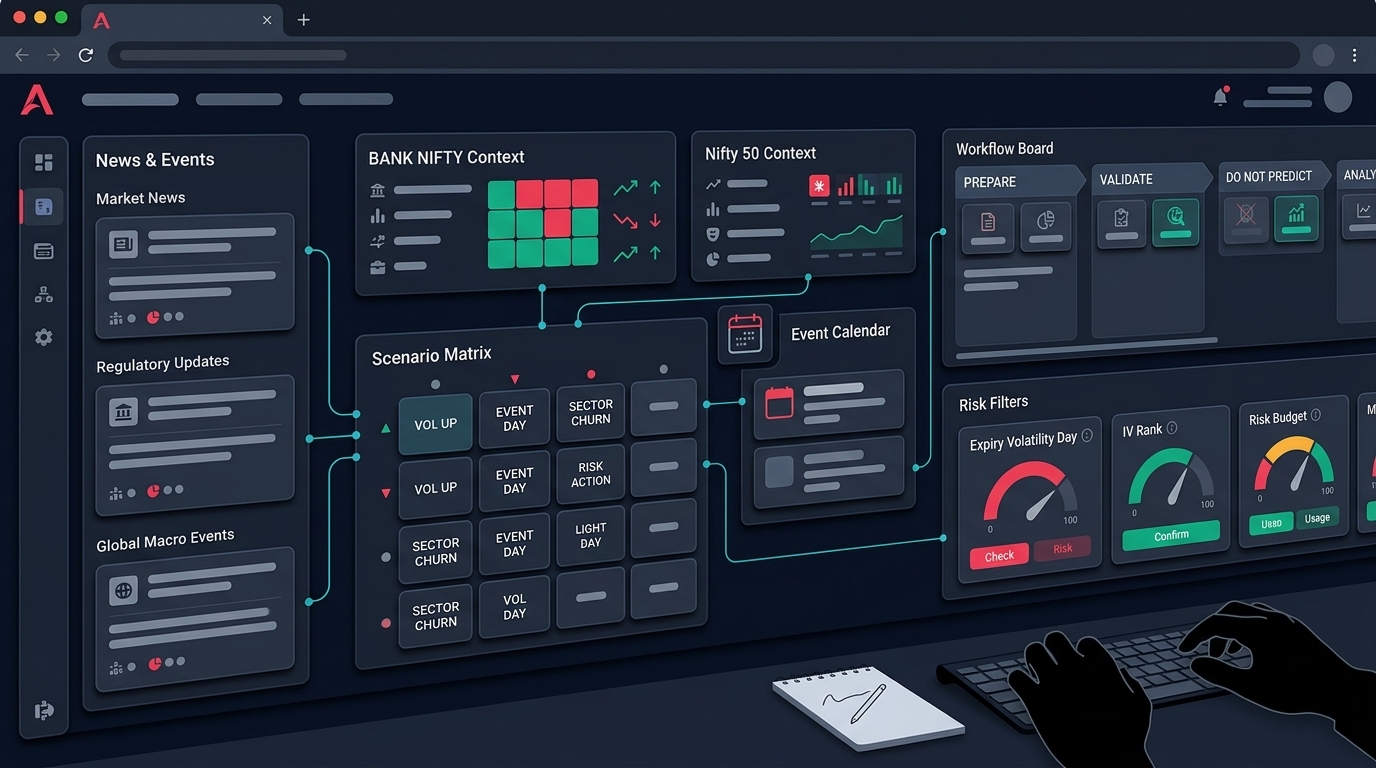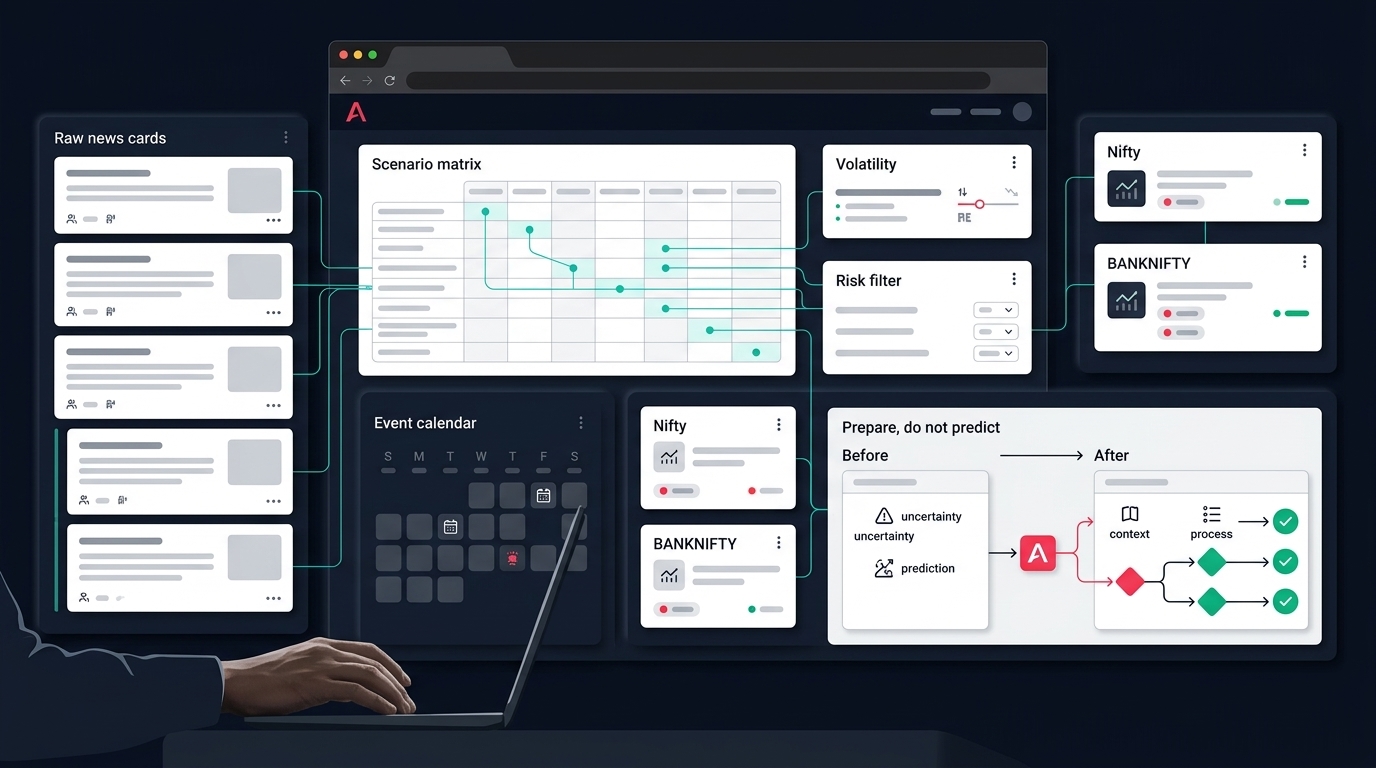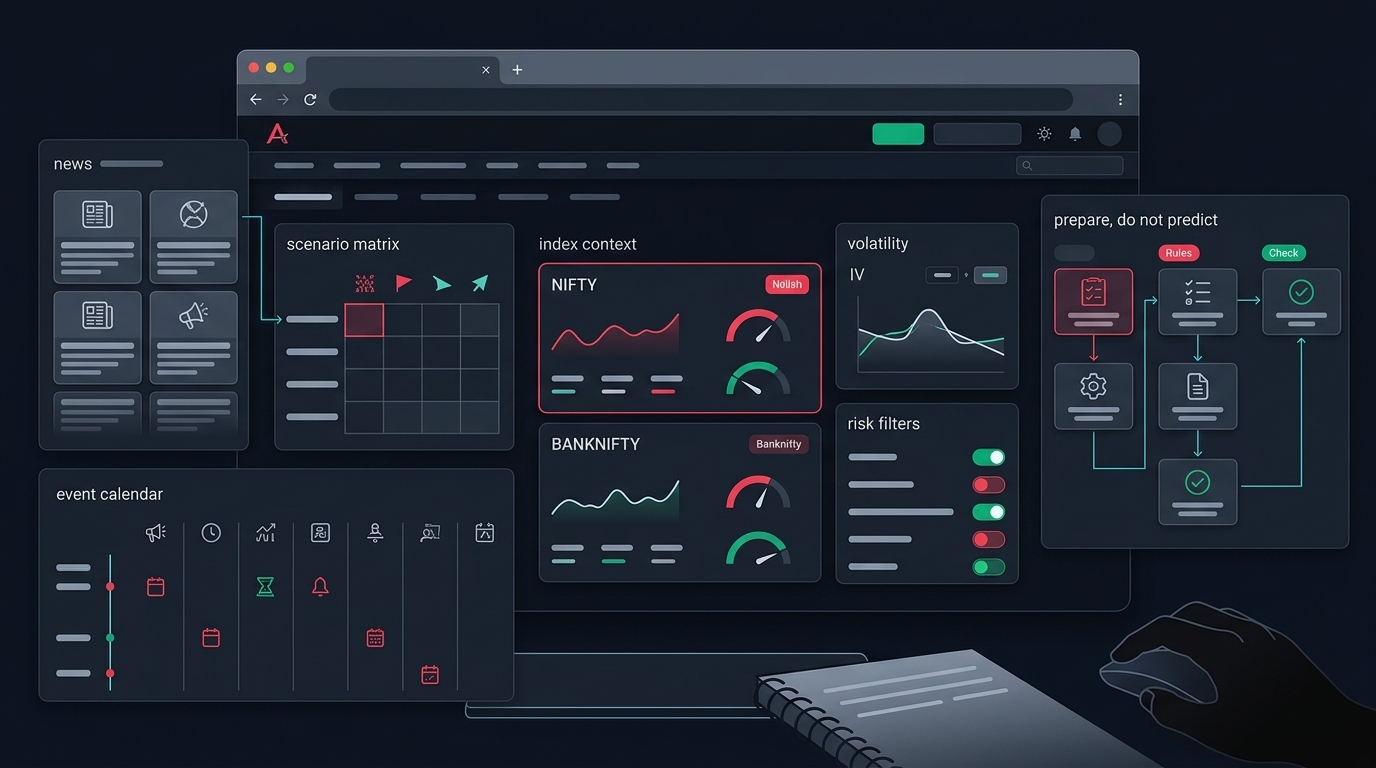
Open the Bank Nifty option chain at the end of September 2026 and it can look broken. Rows that were dense last week are thin. Open interest at strikes you had bookmarked as "the wall" has collapsed. The put-call ratio prints a number that looks like a regime change. Max pain sits somewhere that makes no sense against spot.
Nothing is broken. You are looking at a freshly rolled monthly series.
This is a specific, recurring, entirely predictable condition — and it is one of the most reliable ways for a chain-driven algo to misfire. The rules were calibrated on a mature series with four weeks of accumulated positioning. They are now being fed a series that is a few sessions old. Same code, same thresholds, completely different data density.
This post is about what to check in those sessions, and how to encode the difference so your system knows which kind of chain it is reading.
Why the Bank Nifty chain resets harder than it used to
Bank Nifty currently lists monthly expiries only. Weekly Bank Nifty contracts were discontinued under SEBI's expiry rationalisation, and the chain you see today reflects that. Nifty still runs both weekly and monthly series, with expiry on Tuesday.
Confirm the live position yourself on the NSE option chain page or your broker terminal before you trust any of this — contract specifications and expiry calendars are exchange decisions and they have changed more than once in the last two years.
The practical consequence for anyone automating off the chain: Bank Nifty's open interest structure now builds and unwinds on a monthly rhythm, not a weekly one. Under the old weekly regime, a stale OI wall had a shelf life of a few days. Now it can carry positioning for four weeks — which makes it more meaningful mid-series and almost meaningless right after a roll.
You get two very different chains from the same symbol depending on where you are in the cycle. Most retail algo logic treats them as one.
What actually breaks in the first sessions of a new series
Put-call ratio
PCR is a ratio of two totals. When both totals are small, the ratio is noisy. A few hundred lots of fresh positioning at one strike can swing a day-one PCR in a way it never could against a mature book.
If your system has a rule like "skip long trades when PCR is under 0.8," that rule was almost certainly tuned on series with meaningful OI depth. Applying it on day two of a new series is not a signal, it is a coin flip with extra steps.
Practical check: log total call OI and total put OI alongside the ratio, not just the ratio. Set a minimum aggregate OI floor below which the PCR filter is disabled rather than obeyed. You will need to derive that floor from your own historical chain snapshots — there is no universal number.
Max pain
Max pain is a computation over the full strike ladder. On a young series the ladder is sparse, the far strikes are barely populated, and the computed point can jump several hundred Bank Nifty points between sessions as positioning fills in.
Treat max pain as a late-cycle input. Its stability improves as the series matures and it is most discussed in the final week for a reason. Early in a series it is a number your code can produce but should not act on.
OI support and resistance
The most common chain-derived rule in Indian retail algos is some version of: highest put OI equals support, highest call OI equals resistance. On a mature Bank Nifty series that at least describes where writers have committed capital.
On a fresh series, the "highest OI strike" is often just the first round number that attracted early writers. It has not been tested. Nobody is defending it yet.
Practical check: require a minimum absolute OI at the strike and a minimum ratio versus the second-highest strike before your code labels anything a wall. A strike carrying 1.2x the next one is not a level; it is a rounding artefact.
Fresh OI beats standing OI, and that gap is widest now
The distinction that matters more than any absolute OI reading is change in OI — what is being added or unwound today versus what was carried in.
Bank Nifty is a twelve-stock index dominated by a handful of large private and public banks. It moves faster and further than Nifty on the same input — an RBI decision, a rate commentary, a large bank's results. Its OI concentrations shift more violently intraday than Nifty's. A resistance strike that held through the morning can be run over by a single policy headline.
That is why the change-in-OI column matters more on this index than on Nifty. Standing OI tells you where positions were opened at some unknown point over the last few weeks. Change in OI tells you what is happening now.
Three checks worth automating:
- Direction of the build. Call OI rising with price falling reads differently from call OI rising with price rising. Store both the OI delta and the underlying's move over the same window.
- Where the build is concentrated. Fresh OI clustering one or two strikes above spot behaves differently from fresh OI spread across five strikes.
- Unwinding versus addition. A strike losing OI on a price move is information. Many systems only threshold on OI increases and are structurally blind to unwinding.
If you are inspecting this manually before you encode it, the option chain workspace at /options#chain puts chain rows, leg actions, basket preview and a margin estimate in one view, so you can see how a strike choice changes the risk profile rather than just the entry price. The standalone /option-chain route does the same job when you only want to inspect.
Two clocks running at once
Right now Nifty and Bank Nifty are on different expiry cycles. Nifty carries a weekly series with its own decay and gamma profile. Bank Nifty carries a monthly series that has most of its life ahead of it.
That divergence changes several things a shared codebase usually gets wrong:
Theta is not comparable. A Nifty weekly option days from expiry and a Bank Nifty monthly option weeks out decay at completely different rates. If your position sizing or stop logic uses a single theta assumption across both, one of the two is mispriced.
Gamma exposure is not comparable. Expiry-week gamma risk on the Nifty side has no equivalent on the Bank Nifty side today. A basket holding legs on both indices has a lopsided risk profile that a simple delta-neutral check will not surface.
Event sensitivity is not comparable. A banking-sector event four weeks from now barely touches this week's Nifty options. It sits right inside the Bank Nifty series.
IV levels are not comparable. Bank Nifty IV runs structurally higher than Nifty IV because of the index's concentration and speed. Comparing raw IV numbers across the two indices tells you almost nothing. Compare each against its own recent range instead.
The IV and theta tab at /options#iv sits inside the same options desk as the chain for exactly this reason — volatility and decay context belongs beside strike selection, not after the order. Whether direct buying, spreads, or premium structures fit the current tape depends on where IV sits relative to its own history, and that answer is different for each index today.
The strike ladder detail most backtests skip
Bank Nifty strikes are spaced 100 points apart. Nifty strikes are spaced 50. That single parameter difference quietly breaks a lot of shared strategy code.
If your logic says "sell the strike two steps out of the money," you get a materially different distance on each index. If it says "sell the strike 200 points out," you get two strikes on Bank Nifty and four on Nifty — with different liquidity at each. Neither version is wrong, but you have to know which one you wrote.
On a young series this compounds. The populated ladder is narrower than it will be in three weeks. Strikes far from spot may show wide bid-ask spreads or near-zero volume. A backtest that assumes mid-price fills across the full ladder will report entries your live system cannot get.
Practical check before deploying anything multi-leg on a fresh series: pull the actual traded volume at each leg's strike, not just the LTP. A strike with a printed price and no volume is a number, not a market. Estimate margin with existing positions included so the basket's real capital requirement is visible before execution, not after the rejection.
If you want to stress this properly, run the same structure across series-start and series-end conditions in options backtesting and compare fill assumptions against realised slippage. The difference is usually larger than traders expect.
Encoding series age as a state, not an afterthought
The cleanest fix is also the least glamorous: make "days since series start" and "days to expiry" explicit inputs to your rule set, then let thresholds vary by state.
A workable shape:
- Early series (roughly the first week). OI-derived levels disabled or heavily down-weighted. PCR filters off below the aggregate OI floor. Max pain ignored. Position sizing reduced until liquidity fills in.
- Mid series. Chain structure becomes usable. Fresh-OI checks carry normal weight. Event calendar for the remaining window drives most of the risk budget.
- Expiry week. Gamma and theta rules dominate. Level-based logic gets less reliable as pinning and unwinding take over.
You cannot backtest your way to these boundaries without first recording the data. Most retail traders never log the chain, so they only ever see today's snapshot and have no way to know whether today is unusual. Start capturing a timestamped chain snapshot — OI, change in OI, IV, volume, LTP per strike — even if you have no immediate use for it. Six months of that file is worth more than any indicator you add this quarter.
When you build the resulting logic, a BANKNIFTY strategy builder that lets you express these conditions as rules rather than code keeps the series-age state visible instead of buried in a script nobody re-reads.
Event mapping for the weeks ahead
Without predicting anything: a Bank Nifty monthly series that runs into late October sits across the start of the quarterly banking results season and whatever monetary policy communication falls in that window. Pull the actual dates from the RBI's published MPC calendar and from individual bank filings. Do not rely on memory or on a forum post.
Then do the boring part — mark which of your open or planned structures have material exposure on those dates, and decide the rule now, in a calm session, rather than at 9:20 on the morning of. "Reduce size," "flatten before the event," "hedge the short leg," and "do nothing" are all defensible choices. Deciding mid-event is not.
Breadth context helps here too. A bank stock setup can look clean while the wider financials tape is weak; the index cards and sector heatmap on /indices exist to frame that before you act on a single-name signal. Same idea applies to scanner output — a candidate list is an input to a decision, not the decision.
For a structured weekly version of this framing, the weekly market outlook is meant to be used as preparation, not as a source of trade calls.
The checklist
Run this before you let a chain-driven rule fire on Bank Nifty:
- Which series am I on, and how old is it? Confirm expiry from the exchange calendar, not from a cached value in your config.
- Is aggregate OI above my minimum floor? If not, PCR, max pain and OI-wall logic should be disabled, not trusted.
- Is the "wall" strike meaningfully larger than the next one? Set a ratio threshold and enforce it.
- Am I reading change in OI or standing OI? Prefer fresh builds and log both.
- Does each leg's strike have real traded volume? Printed LTP with no volume is not a fill.
- Is my strike-step parameter index-aware? 100 for Bank Nifty, 50 for Nifty — hardcoding one of them breaks the other.
- Is IV compared against this index's own range? Cross-index IV comparison is noise.
- Are my theta and gamma assumptions per-series? A Nifty weekly and a Bank Nifty monthly do not share a decay profile.
- Have I mapped the event calendar across the full series window, not just this week?
- Is my per-day loss cap and per-basket cap active before the first order? Everything above is analysis; this is the part that limits damage when the analysis is wrong.
Point ten is the one that actually protects capital. The rest improves your odds of being right; a hard risk management limit decides what happens when you are not.
If you want to build and dry-run this kind of series-aware logic against your own rules before committing capital, you can request early access and test the workflow end to end.
None of this tells you what Bank Nifty will do. It tells you whether the chain you are reading today is dense enough to carry the weight your code is putting on it. On a freshly rolled series, usually it is not — and knowing that is the edge.