Most retail algo traders read the Bank Nifty option chain the same way they read the Nifty chain. Same PCR threshold, same "highest OI is resistance" logic, same IV filter. That worked reasonably well when both indices had weekly expiries. It works much worse now.
Since SEBI's expiry rationalisation, Bank Nifty trades monthly contracts only, while Nifty continues to run weekly and monthly series settling on Tuesday. That single structural difference changes what open interest, PCR, and implied volatility actually mean on each chain — and if your strategy code treats both as interchangeable inputs, it is silently comparing a month-old positioning book against a few-day-old one.
This post is about the normalisation layer that has to sit between a live chain and a trading rule. No calls, no levels to act on. Just the process checks.
Where the two chains stood on 29 September 2026
Public option chain pages on 29 September 2026 showed roughly this positioning picture:
- Nifty: heavier call OI clustered near the 24,000 strike, put OI support building near 22,000, put-call ratio around 0.62.
- Bank Nifty: call OI concentration near 57,500, put side near 54,000, PCR around 0.69.
- India VIX: in the mid-13s, up about 1.5% on the day.
Treat all of that as a snapshot, not a state. OI concentrations shift intraday, PCR moves with every fresh build, and a single policy or results headline can overrun a strike that held all morning. The useful observation is not the numbers themselves — it is that the two chains were showing different PCR readings and different skews, and any algo that compares them needs to know whether that gap is real information or just a measurement artefact.
29 September 2026 is also the last Tuesday of the month, which is the settlement slot the rationalised calendar points to for monthly series. Before your algo hardcodes that, pull the expiry dates from the exchange contract file. Calendar assumptions are one of the cheapest bugs to prevent and one of the most expensive to discover live.
Why the same chain reading breaks across two indices
Strike spacing changes what "one strike away" means
Nifty strikes are spaced 50 points apart. Bank Nifty strikes are spaced 100 points apart. On a Nifty near 23,000, one strike is roughly 0.22% of spot. On a Bank Nifty near 56,000, one strike is roughly 0.18% of spot — close in percentage terms, but the point distances feed straight into stop logic, chase-distance filters, and strike-offset rules.
If your strategy says "sell the strike 300 points out of the money," that is six strikes on Nifty and three on Bank Nifty. Same code, completely different delta exposure. Any filter written in absolute points is an index-specific constant pretending to be a general rule.
Standing OI ages differently in a monthly-only series
This is the bigger break. In a weekly series, standing open interest is at most a few sessions old. Positions that are wrong get unwound fast because expiry is close. The chain is a relatively fresh picture of who is positioned where.
In a monthly-only series, the chain carries weeks of accumulated positions. Some of that OI is genuinely defending a level. Some is a hedge leg against a stock F&O book. Some is a rolled position nobody is actively managing. Bank Nifty is a 12-stock index dominated by a handful of large banks, so a single bank's results or an RBI policy line can move it further than Nifty on the same news — and the standing OI wall you trusted gets cut through without the chain warning you first.
The practical consequence: on a monthly-only chain, change in OI matters more than total OI, and it matters more than it does on a weekly chain. A strike adding OI in the current session is telling you about today's intent. A strike carrying a large but static OI number is telling you about something that may have been decided three weeks ago.
Four normalisations before any cross-index rule
If you want one strategy to read both chains, normalise first. Do this in the data layer, not inside strategy logic — otherwise every new rule repeats the same conversion and one of them will get it wrong.
1. Distance in percent of spot, not points
Convert every strike distance, stop, and chase filter into percent of spot or into number-of-strikes. Store both. A rule like "skip entry if price has already moved more than 0.4% from the signal level" transfers across indices. "Skip if more than 90 points" does not.
2. OI in change terms, with an age tag
For each strike, keep total OI, change in OI for the session, and days elapsed since the series started trading. That third field is what lets you say "Bank Nifty standing OI is on day 18 of its series, Nifty's is on day 3" — and to weight them differently. Comparing raw PCR across a day-3 chain and a day-18 chain is not a comparison at all.
3. IV as a percentile, not a level
Bank Nifty IV runs structurally higher than Nifty IV. That is a property of the index, not a signal. An absolute threshold like "only sell premium when IV is above 15" will fire constantly on one chain and almost never on the other.
Use a rolling percentile per underlying instead — where does today's ATM IV sit inside its own last 60 or 120 sessions? Then "IV in the upper third of its own range" means the same thing on both chains. Also check the IV at your strike against neighbouring strikes: buying into a locally inflated strike means the position has to beat direction and volatility normalisation.
4. Time-to-expiry as an explicit regime label
Do not let days-to-expiry sit in your code as a raw number that a few scattered conditions read. Make it a label the whole system can branch on — something like far, mid, expiry_week, expiry_day — and define it per underlying, because Nifty and Bank Nifty will sit in different buckets on the same date. On 29 September, a Nifty weekly and the Bank Nifty monthly can both be in their final session while a later Nifty weekly sits in far. One date, three regimes.
Turning the comparison into risk filters
Once both chains are on comparable footing, cross-index context becomes usable as a filter, not a signal generator. Some checks worth building:
Divergence in fresh OI direction. If today's OI build is stacking on the put side in one index and the call side in the other, participation is split. That is a reason to reduce size or require an extra confirmation, not a reason to pick a side.
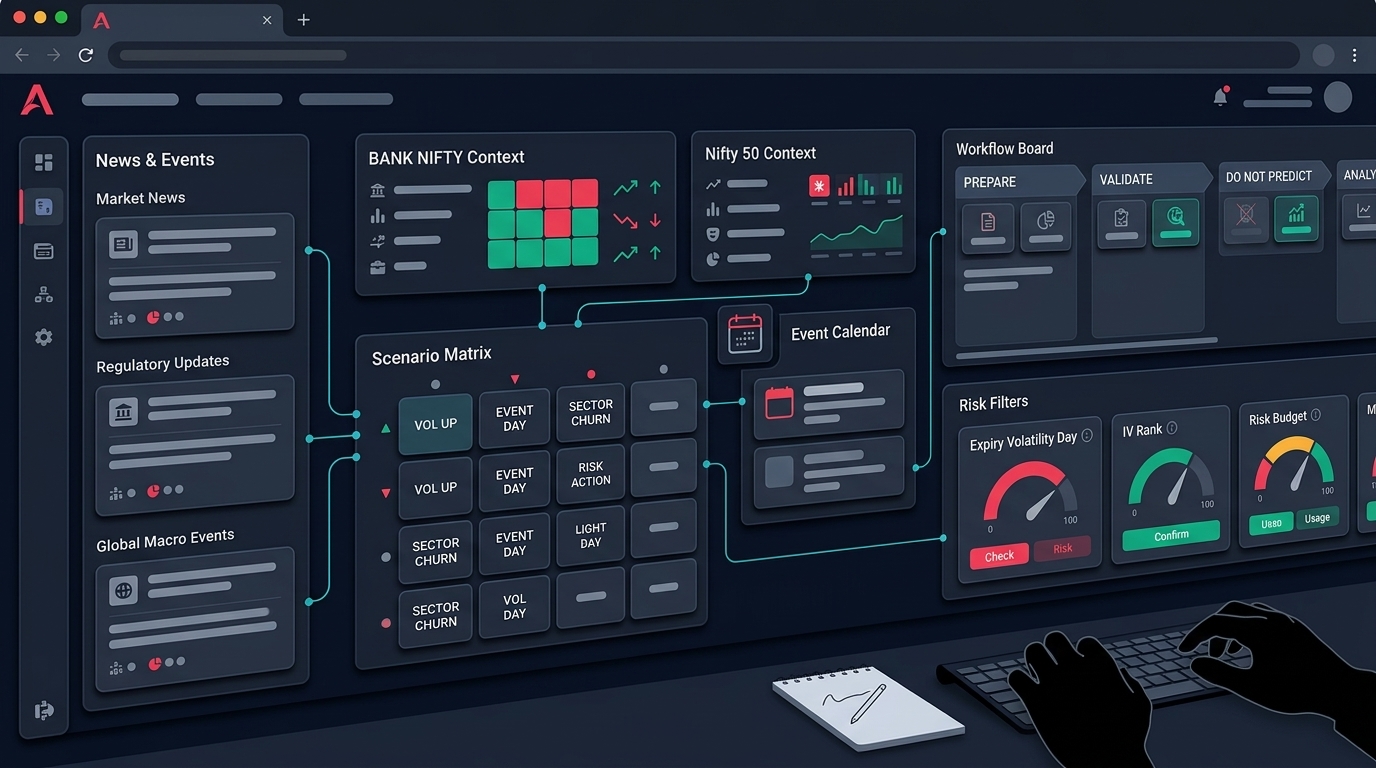
Breadth confirmation before index option structures. An index level can hold while the constituents underneath it deteriorate. Bank Nifty especially — a 12-stock index can be carried or dragged by two heavyweights. Check sector participation before you trust a chain-derived level; an index and sector heatmap view is context for that, not a prediction of it.
Liquidity gate per leg, per index. Bid-ask spread as a percentage of premium, not in rupees. A four-rupee spread on a 300-rupee premium is different from a four-rupee spread on a 12-rupee premium. Set the gate in percent and apply it to every leg of a multi-leg structure separately — the worst leg determines your real cost.
Basket-level risk, not leg-level. For any spread or hedged structure, the stop belongs at the basket level. Leg-level stops on a hedged position can leave you holding a naked leg exactly when volatility expands. This is standard risk management plumbing, and it is the check most often missing in strategies that look fine in backtest.
What to log so the backtest matches live
Cross-index rules are harder to backtest honestly than single-index rules, because you need both chains synchronised. Minimum fields, timestamped, at a fixed interval through the session:
- Spot, futures price, and basis for each underlying
- Per-strike: OI, change in OI, IV, LTP, bid, ask, volume
- ATM IV and your rolling IV percentile
- PCR and where your fresh-OI concentration sits
- Your computed regime label and the reason any entry was blocked
That last field is the one people skip and later regret. If your system rejected an entry because the chase distance was too wide or the spread gate failed, log the reason. Without it you cannot tell a filter that saved you from a filter that is quietly killing your edge.
Then be sceptical of the results. A backtest on synchronised chain snapshots will still understate gap risk, and expiry-session fills are the least reliable part of any options options backtesting run. If your strategy's returns depend heavily on the last hour of expiry, stress the fill assumptions before trusting the equity curve. A BANKNIFTY strategy builder workflow is only as honest as the data and fill model behind it.
Event and expiry avoidance rules
Some of the cheapest risk control is simply not being in the market at certain moments. Worth encoding as hard blocks rather than discretionary judgement:
- Policy announcement windows and scheduled macro releases
- Results days for the largest Bank Nifty constituents, given how concentrated the index is
- The final settlement window on expiry day, where gamma exposure on short options rises sharply
- Any session where your data feed showed a gap, stall, or reconnect — stale chain data is worse than no chain data
Blocks should be dated entries in a config file your algo reads, not comments in code. And they should apply per underlying, because Bank Nifty's monthly-only cycle means its high-risk sessions cluster differently from Nifty's.
Keeping the workflow in one place
The reason cross-index chain logic goes wrong is usually not the math — it is that the chain lives on one page, IV on another, margin in the broker terminal, and positions somewhere else. By the time a trader has assembled the picture, the setup has moved.
Anadi's options desk keeps chain inspection, OI analysis, IV and theta context, strategy structure, basket preview, margin estimate, and position follow-up in the same workspace, across NIFTY, BANKNIFTY, FINNIFTY and MIDCPNIFTY. The point is sequencing: you see the risk and margin implication of a structure before you send it, not after. Similarly, the Action Center shows scanner candidates with entry quality, blocked reasons, and F&O routing context, so a signal has to pass a filter before it becomes an order.
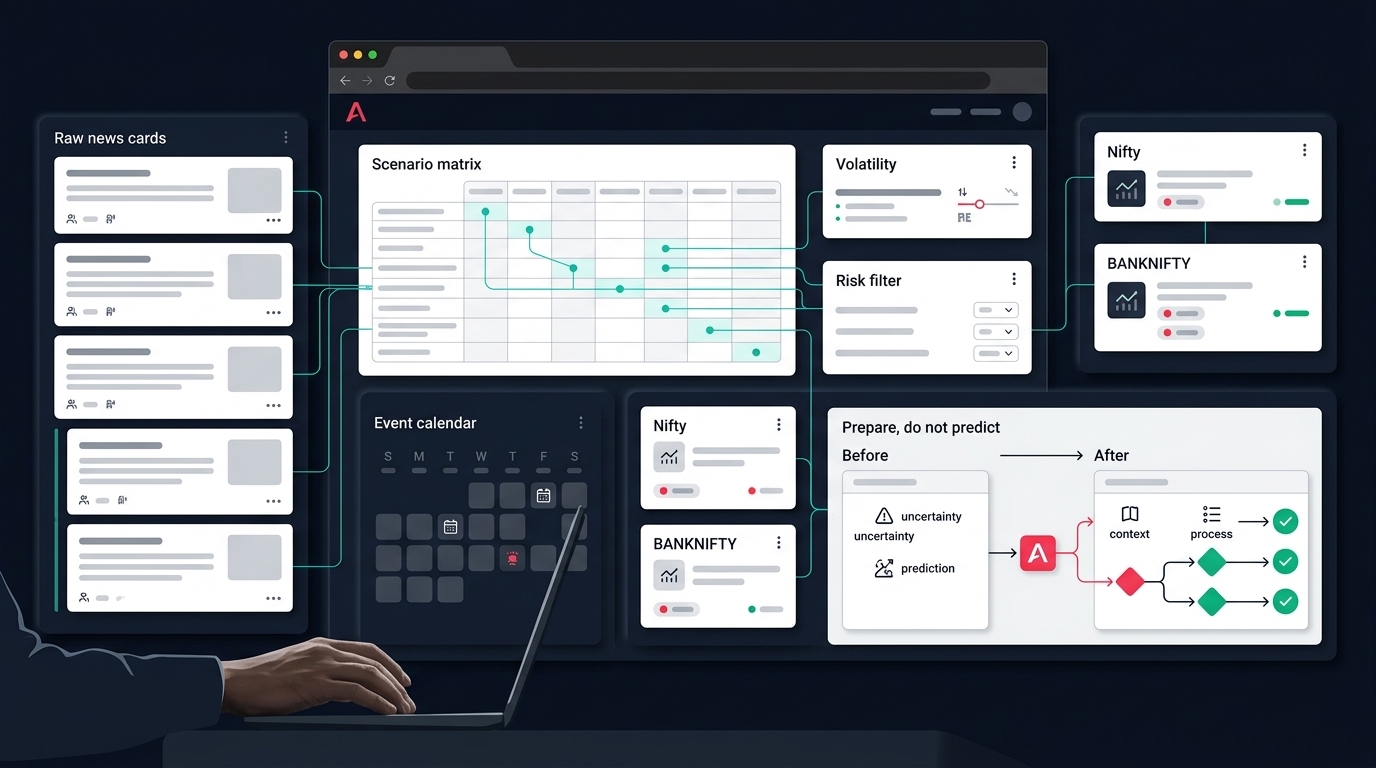
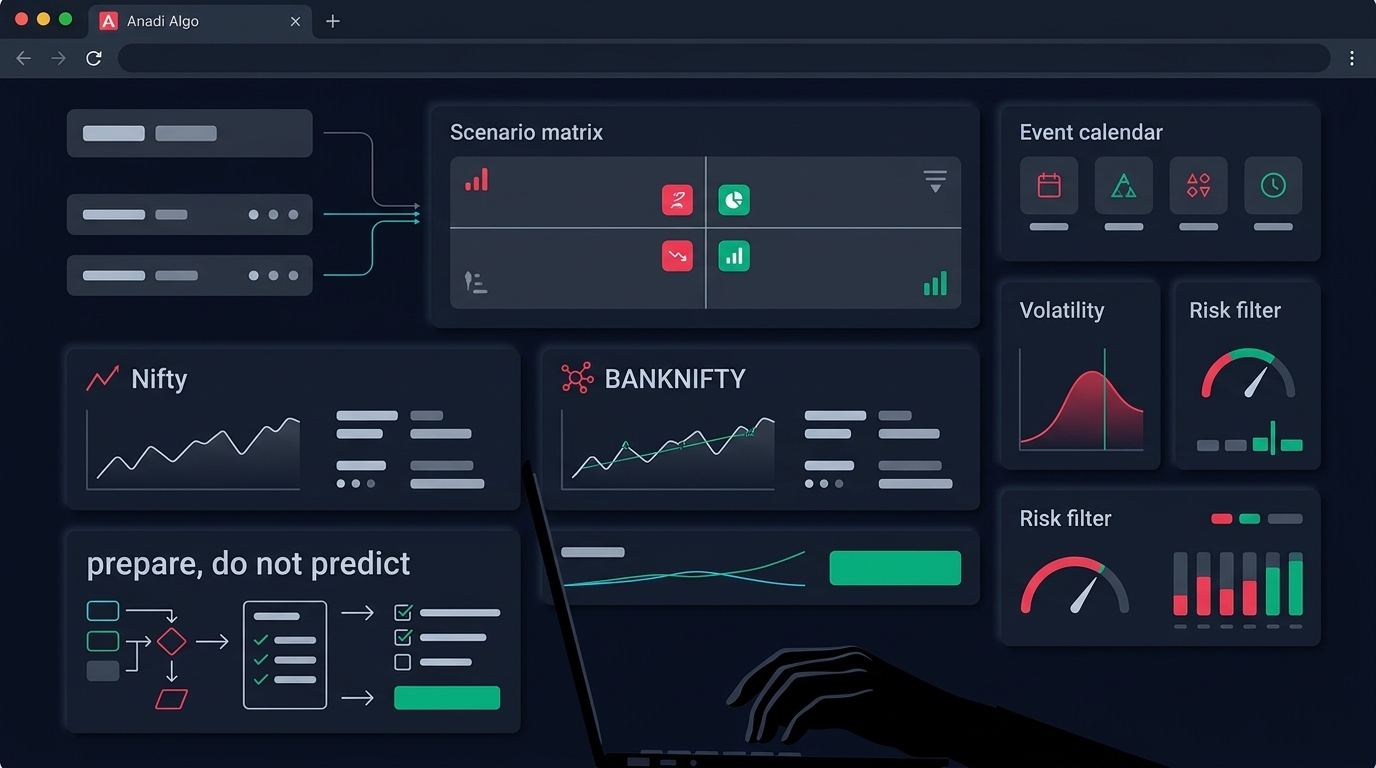
Use market context to prepare a process, not to chase a call. That is also the framing behind the weekly market outlook — scenarios and conditions, not targets.
If you want to test this kind of normalised, multi-index chain workflow on your own rules, you can request early access and run it in paper mode first.
Checklist
Before letting any rule read both chains:
- Expiry dates pulled from the exchange contract file, per underlying — not hardcoded.
- All distances stored in percent of spot and number-of-strikes, never bare points.
- Change in OI weighted above standing OI, with a series-age tag attached.
- IV compared as a rolling percentile per underlying, not an absolute threshold.
- Time-to-expiry exposed as a regime label the whole system branches on.
- Spread gate in percent of premium, applied per leg.
- Stops defined at basket level for every hedged structure.
- Blocked-entry reasons logged with timestamps.
- Event and expiry blocks in dated config, per index.
- Backtest fill assumptions stress-tested separately for expiry sessions.
None of this tells you what to trade. It tells you when your rules are reading the chain correctly — which is the part that has to be right before anything else can be.