Most "global cues" posts assume the shock is directional. One headline, one gap, one trend day. That is not what the last few weeks have looked like.
Reports through early August 2026 show crude moving in both directions on almost alternate sessions. Prices reportedly slid around 5% below $84 on August 3 after a delayed strike, moved back near $85 on August 4 as peace-talk uncertainty returned, dipped for a third session on August 5, fell under $80 on August 6 on hopes of an Iran-Oman deal, and climbed back above $83 on August 7 as the Strait of Hormuz deadlock continued. Late July reports had it near $88.
Meanwhile Indian equities took the pressure. The Times of India reported Sensex shedding over 450 points and Nifty50 closing below 24,600 on August 7 as crude rose. Back on July 14, reports showed the Nifty gapping down toward 24,039 with the rupee weakening past 96 per dollar, banking, financial and auto names leading declines while FMCG, pharma and metals held up.
That is not a trend. That is a two-way headline regime. And the two require completely different handling from an automated system.
Why a two-way regime is harder than a crash
A directional shock is actually easy for a rules-based system. Volatility expands, your stop widens or your filter blocks entries, and you sit out or ride one side. Painful, but survivable.
A whipsaw regime is worse because every individual day looks tradeable. Wide range, clean-looking breakout, strong first-hour move. Then the tape reverses on the next headline out of a negotiation room you cannot see.
Three specific things break:
- Breakout systems bleed. A range of $79 to $88 in crude in roughly a week means the risk premium in Indian equities is being repriced every session. Levels break and un-break.
- Trailing stops get picked off. Intraday reversals that would be noise in a calm market become full stop-out moves.
- Overnight positions become coin flips. The July 14 session opened with a gap down of over 160 points on the Nifty and then recovered to an intraday high above 24,259. Gap direction told you almost nothing about the day.
If your system has no concept of which regime it is in, it will keep sizing and stopping as though nothing changed.
Turn the seven triggers into inputs, not opinions
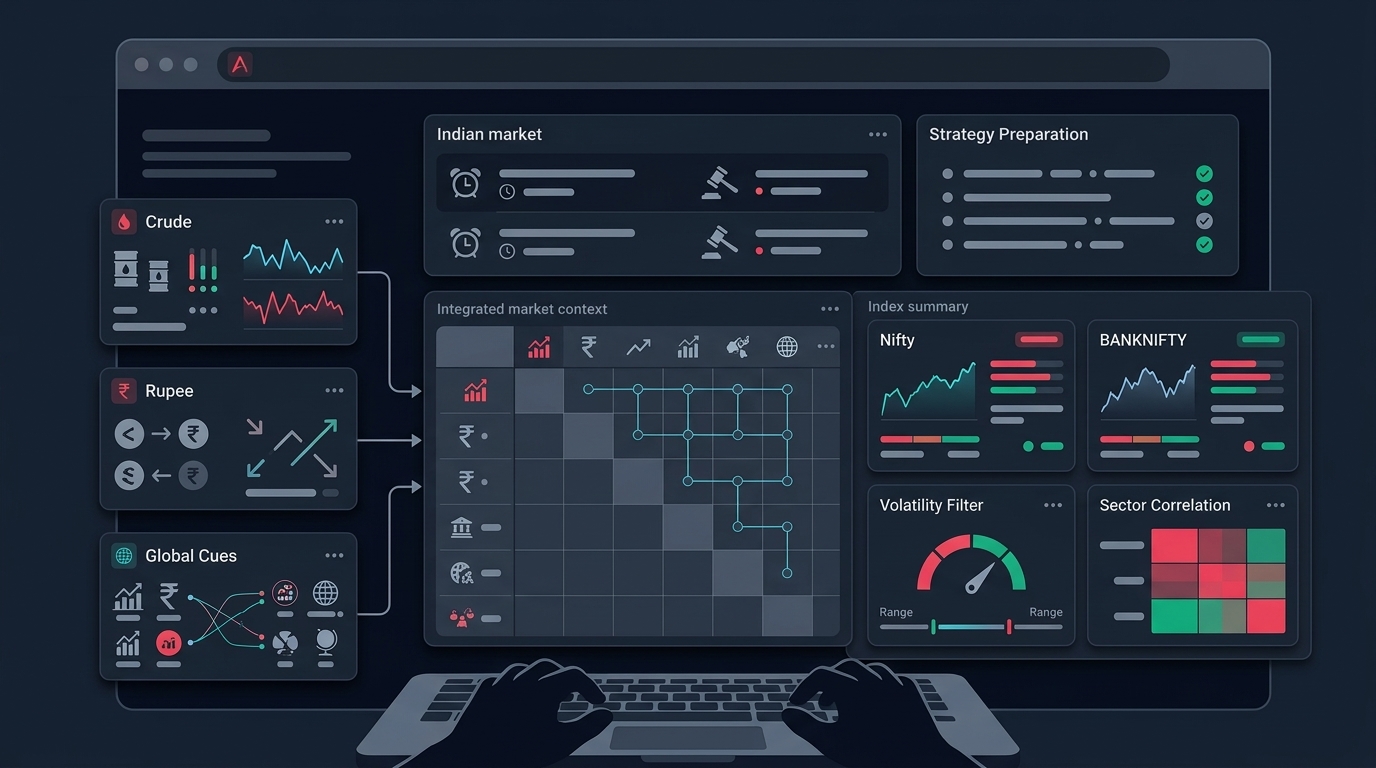
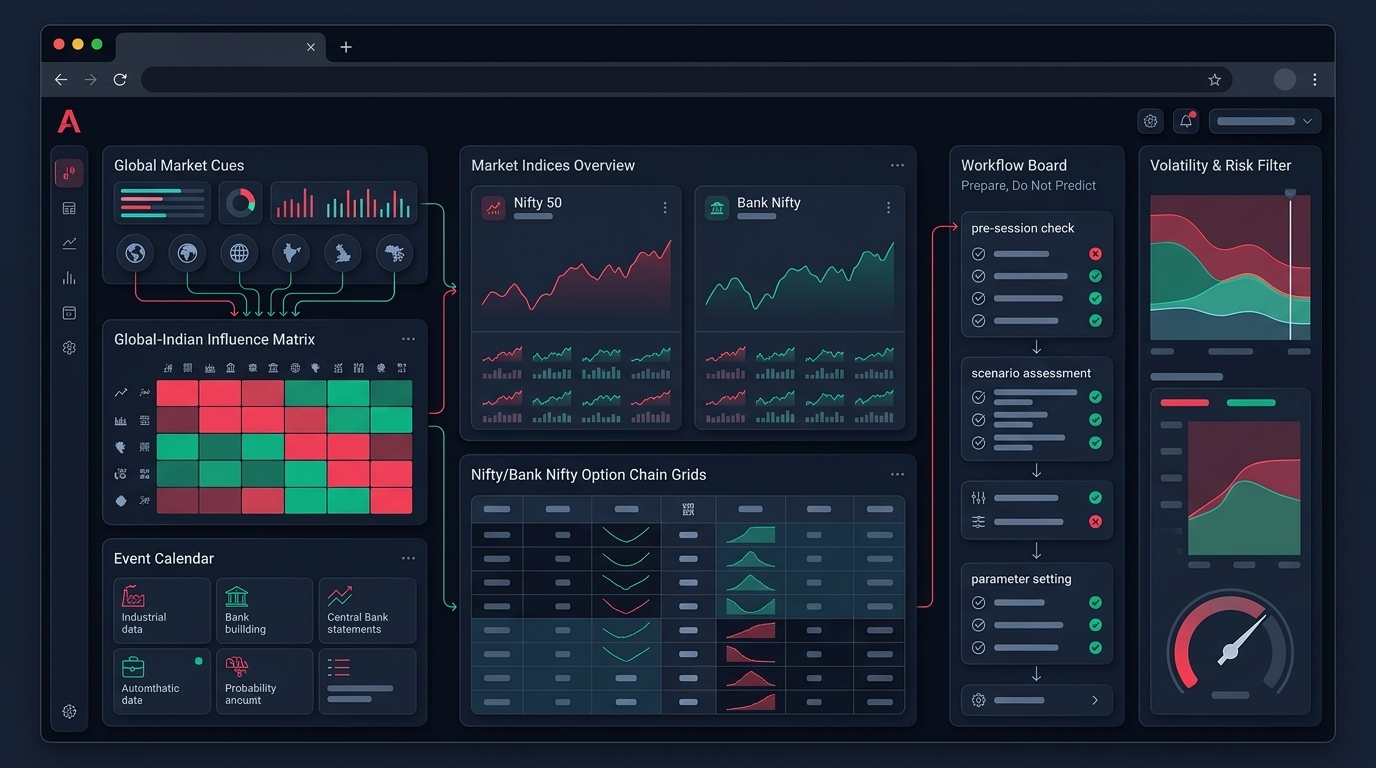
The Financial Express framing lists seven triggers: crude oil, the rupee, bond yields, foreign flows, safe-haven demand, sector impact, and global market cues. That is a useful checklist for a human. It is not yet a system.
The honest split is this.
What you can actually encode
Some of these are numeric, updated daily or intraday, and testable:
- Crude level and its 5-day range width
- USDINR level and rate of change
- GIFT Nifty premium or discount at pre-open
- India VIX versus realized volatility of the last 10 sessions
- Sector index dispersion (how far apart the best and worst sectors are today)
These can become gates. Not predictions — gates. "If condition X, then reduce size / skip the first 15 minutes / do not carry overnight."
What stays as context
Foreign flow numbers arrive after the close. Bond yield moves reflect fiscal anxiety with a lag. Safe-haven demand is a narrative wrapper around gold prices. Geopolitical escalation has no numeric feed at all.
Treat these as inputs to your weekly review, not your intraday logic. Trying to encode "escalation risk" into an entry condition is how traders end up with a curve-fit rule that fires four times a year.
The test for any global cue is boring but reliable: can you state it as a number, with a threshold, that would have been available before the entry? If not, it belongs in your weekly market outlook notes, not your strategy file.
Build three risk states and let them drive behaviour
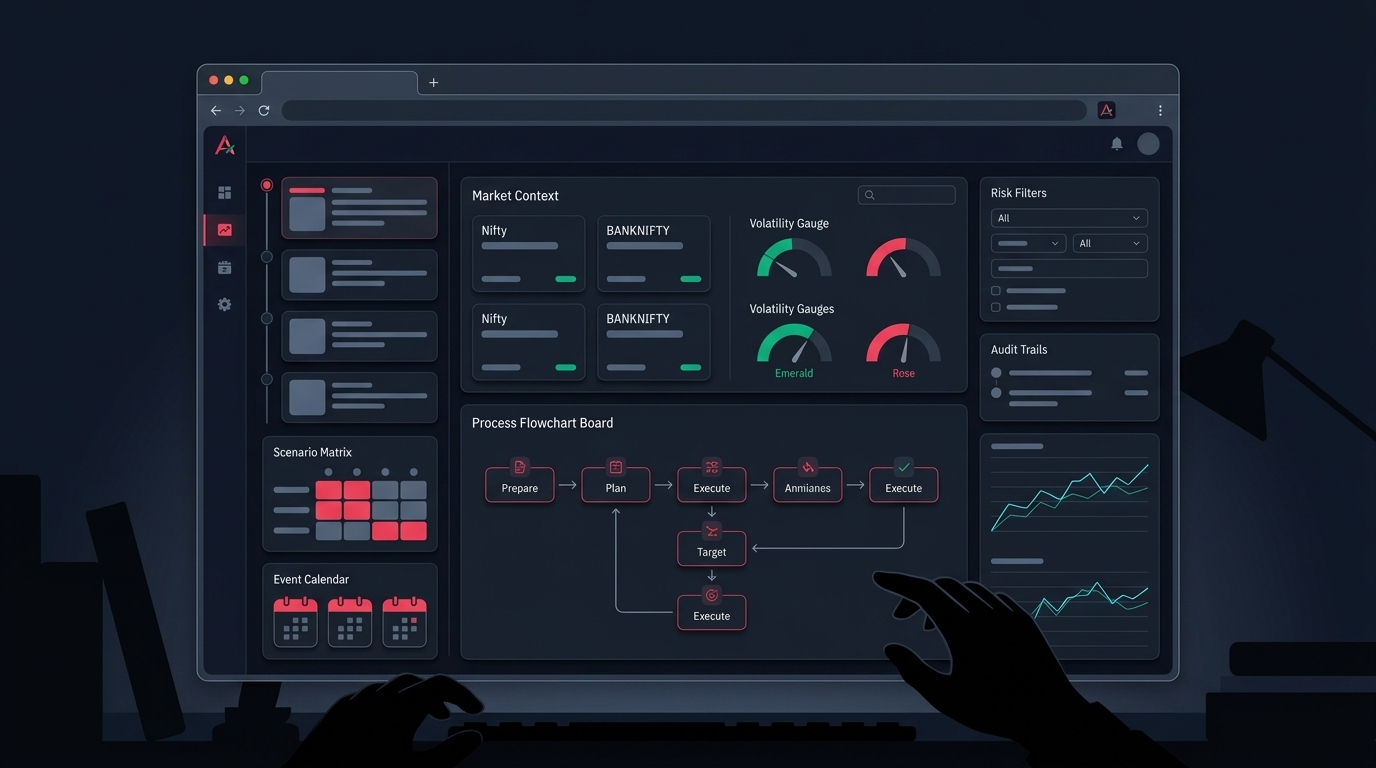
This is the part most retail algo setups skip. Instead of one static config, define a small number of risk states and map every trading parameter to them.
| State | Rough trigger | What changes |
|---|---|---|
| Normal | Overnight gap inside typical range, VIX near its recent average | Standard size, standard filters |
| Elevated | Gaps larger than usual, crude range wide, VIX up but not extreme | Reduced size, tighter entry quality filters, no overnight carry |
| Shock | Very large gap, disorderly open, VIX jump | New entries paused, existing positions managed to flat or hedged |
The thresholds are yours to define from your own instrument's history — that is the work. But three states with clear boundaries beats a single mode with a nervous human overriding it.
Anchor thresholds to your own data
Do not import someone else's numbers. Compute, for your instrument and timeframe:
- Median overnight gap, in points and as a percentage of 20-day ATR
- The 80th and 95th percentile of that gap
- Median daily range in Normal periods versus the last 10 sessions
- Your strategy's win rate and average slippage in the top quintile of volatility days
If your strategy has 200 backtested trades and only 12 of them fall in the highest-volatility bucket, you do not have enough evidence to trade that bucket confidently. That is a finding, not a failure. It tells you the honest answer is to sit out.
Make the state visible before the open
A risk state that gets computed at 9:20 is too late. Compute it at 8:55 from what you already have: previous close, GIFT Nifty, overnight crude move, USDINR, and the size of the largest overnight move in the last five sessions.
Write it down. One word. Then trade that word.
What changes in options specifically
Options are where a two-way regime does the most quiet damage, because premium behaviour stops matching your backtest assumptions.
IV crush is not symmetric. When headlines resolve favourably — say, a negotiation report cools crude — implied volatility can drop fast even if the index barely moves. A long-option position loses on both legs of that. Short-option positions get the opposite: they look great until the next escalation headline.
Spreads widen exactly when you need them. On the July 14-type sessions, far strikes see wider bid-ask and thinner depth. If your options backtesting assumed mid-price fills, your live results will not match, and the gap will be largest on precisely the days your strategy trades most.
Basket legs fill at different times. A four-leg structure entered during a volatile open can leave you directionally exposed between fill one and fill four. In a whipsaw regime that exposure window is expensive.
Practical checks before you run an options strategy through a week like this:
- Re-run your backtest with slippage doubled and see whether the edge survives
- Check the fill assumption on your worst 20 backtested days specifically
- Confirm your basket has a defined behaviour for partial fills
- Verify your margin estimate accounts for existing positions, not just the new basket
If the edge only exists at mid-price fills, it is a data artefact, not a strategy.
Reading sector behaviour without turning it into a tip
The July 14 reports described banking, financial and auto stocks leading declines while FMCG, pharma and metals stayed positive. That pattern is consistent with an oil-and-currency stress narrative — importers and rate-sensitives under pressure, defensives holding.
Useful as a breadth input. Dangerous as a trade idea.
The process version: measure dispersion, not direction. If sector performance is tightly clustered, index-level strategies behave normally. If dispersion is very wide, index strategies are averaging over two different markets, and single-stock scans will throw signals that have nothing to do with the pattern you thought you were trading.
Inside a stock scanner workflow, this shows up concretely. On a wide-dispersion day, the same trendline-breakout signal on an oil-sensitive name and a defensive name carry very different follow-through odds. The scanner cannot know that. You can, and you can encode it as a sector filter or a reduced-size rule.
Where the workflow actually catches you
Signals are cheap in this kind of market. Filtering is the whole job.
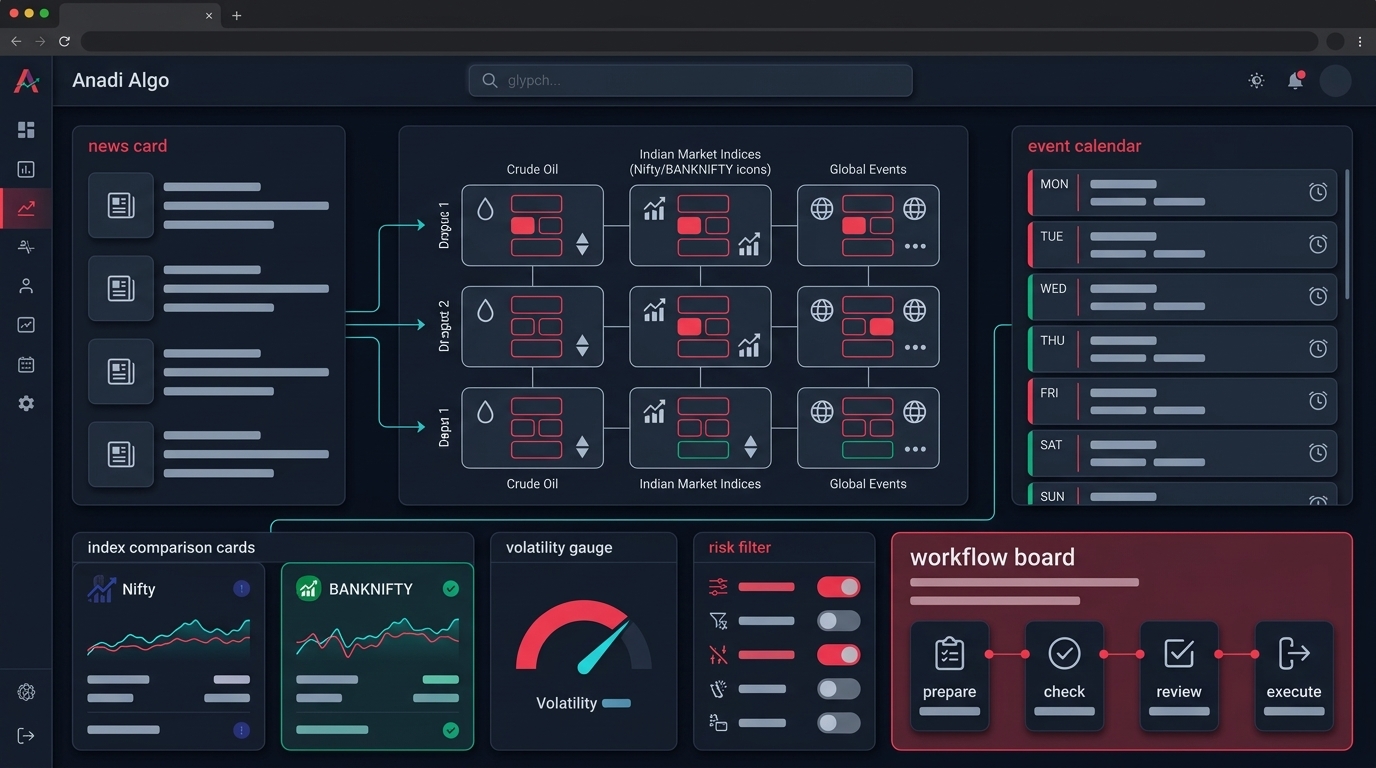
In Anadi's Action Center, scanner candidates come with freshness, signal stage, entry quality, and blocked reasons — things like chase distance or an invalidated price level. Those blocked reasons matter far more in a two-way regime than in a trending one, because the most tempting-looking signal on a whipsaw day is usually the late one, fired after the move has already extended.
The rest of the chain is the same discipline:
- Screener signal with the exact pattern name preserved, not flattened into a generic "breakout"
- Chart modal to confirm the geometry is real and the timeframe matches your rule
- Option Chain to check strike liquidity and what the structure actually costs before the basket goes anywhere near an order
- Margin estimate with existing positions included
- Paper trading first, through at least one full volatile week, before any live capital
And underneath all of it, a hard risk management layer: a daily loss limit that halts the system, a max-trades-per-day cap, and a rule for what happens when your broker session drops mid-session. Volatile weeks are when infrastructure failures and strategy drawdowns arrive together.
A checklist for a week like this
Nobody knows where crude, the rupee, or the negotiation headlines go next. That is not the useful question. The useful question is whether your system behaves sanely across a range of outcomes.
Run through this before the open:
- Classify the state. Normal, Elevated, or Shock — one word, written down by 8:55.
- Check the gap against ATR. Overnight gap as a percentage of 20-day ATR, not in absolute points.
- Confirm sample size. Does your strategy have enough backtested trades in this volatility bucket to justify trading it today?
- Cut size mechanically. Elevated state means a pre-defined reduction, decided in advance, not negotiated at 9:16.
- Kill overnight carry above your threshold. Or hedge it explicitly. Do not leave it to mood.
- Widen your slippage assumption. Then check whether the strategy is still worth running.
- Verify broker session and order routing. Before the volatile open, not during it.
- Set the daily loss limit and let it win. No manual override on a headline-driven day.
- Log what actually happened. Gap, realized range, fills versus expected, and which blocked reasons saved you.
- Review weekly, not intraday. Context reading belongs to the weekend, not the 11:30 lull.
Point 9 is the one that compounds. Two weeks of honest logs through a regime like early August 2026 will tell you more about your system's real behaviour than another three months of calm-market backtesting.
If you want to build and test these filters on a platform where the scanner, strategy builder, backtest, and paper-trade layers are part of one workflow rather than four disconnected tools, you can request early access and start with paper mode.
Context is for preparation. It is not a signal, and it is not permission to take a bigger position than your rules allow.