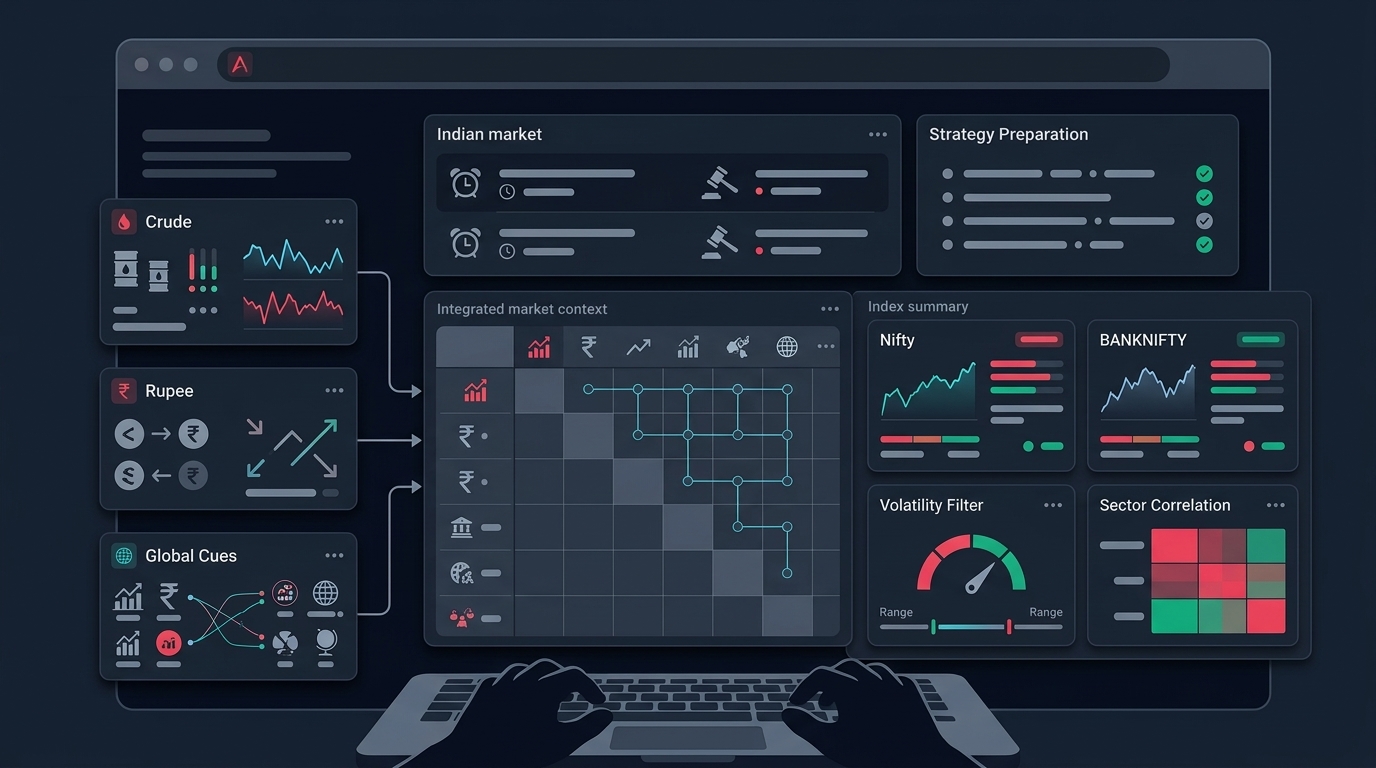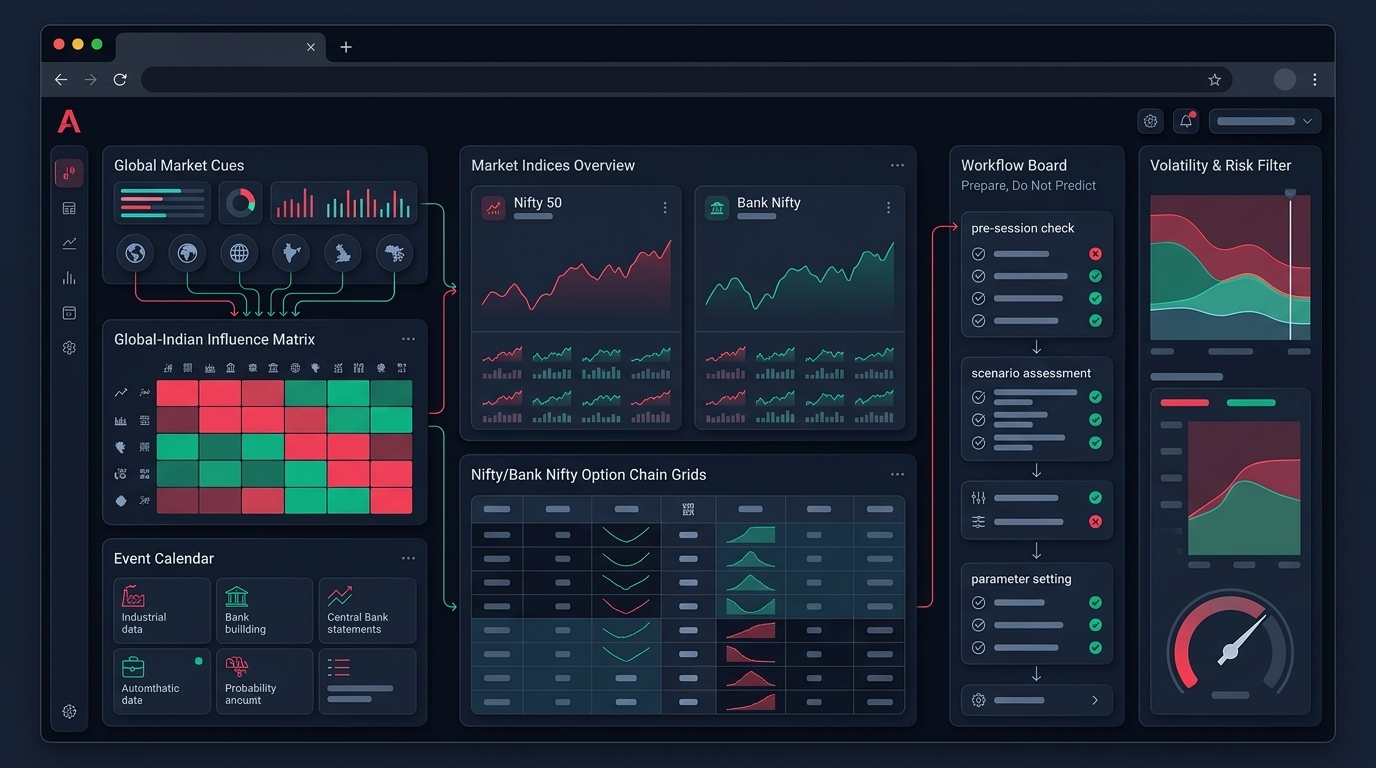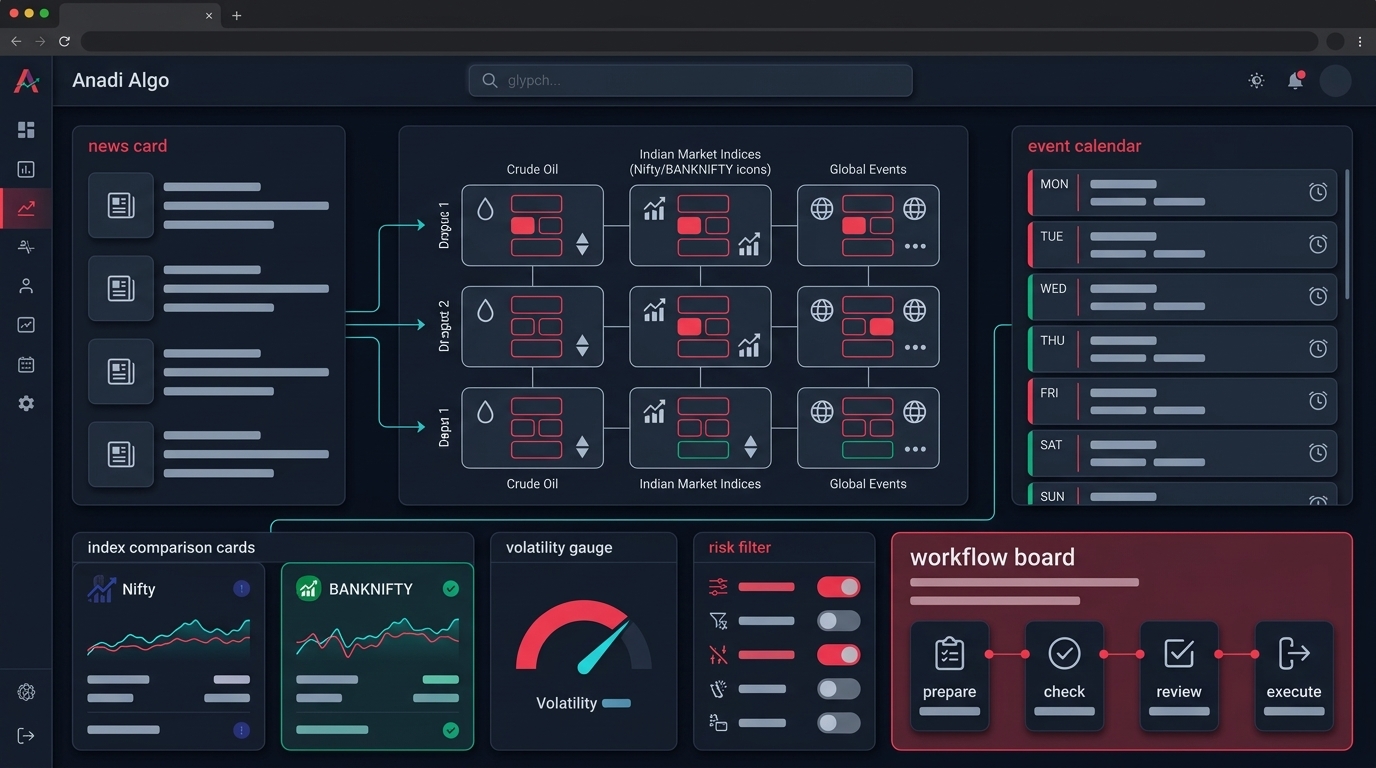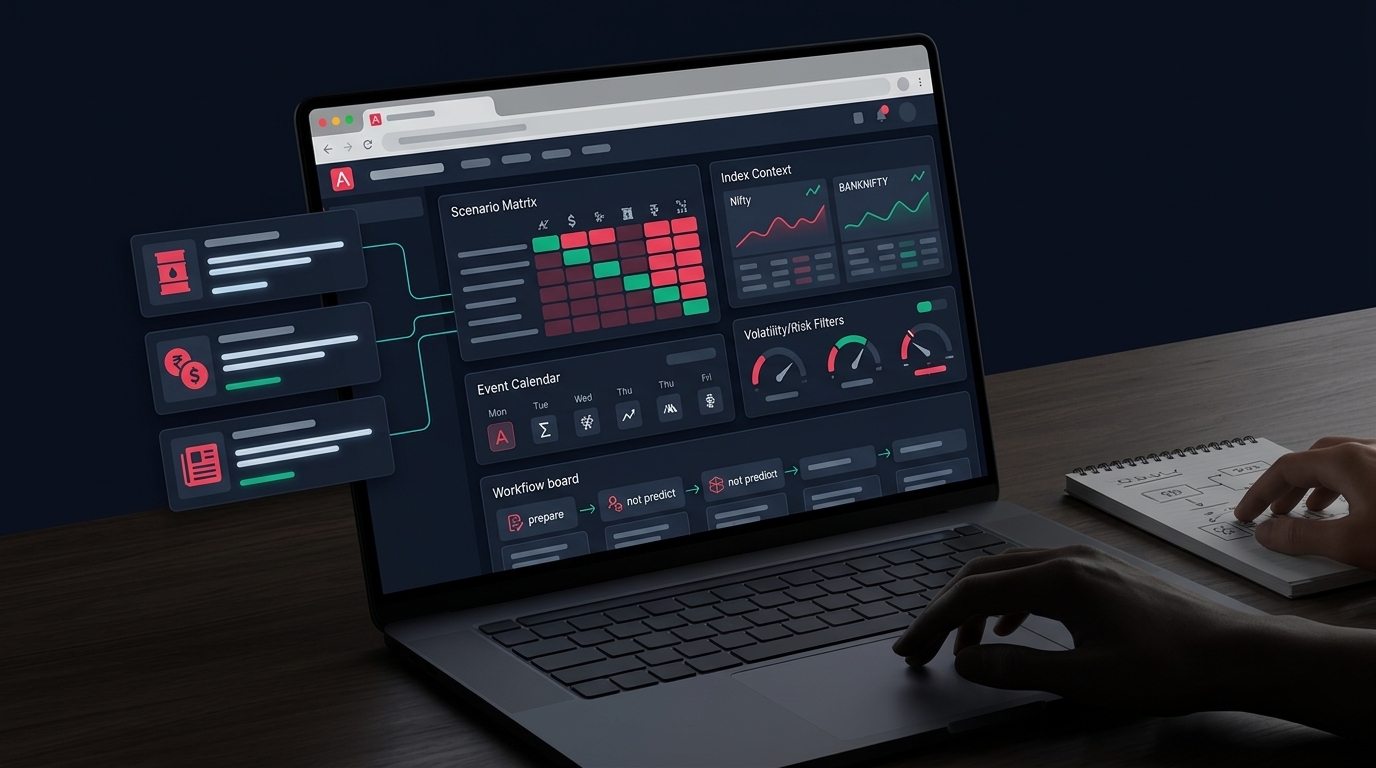
Nifty and Sensex opened close to flat on several sessions in the last week of July 2026. If you only looked at the opening tick, you would assume a quiet tape. The week underneath that tick was anything but quiet — crude oil moved in double-digit percentage swings, the rupee sat near record-weak territory, and foreign flows flipped direction inside five sessions.
That gap between "flat open" and "violent driver" is exactly where mechanical systems get hurt. A backtest that was fitted on a calm regime does not know it is now running inside a headline-driven one. It just keeps placing orders.
This post is about process, not direction. No view on where Nifty goes. The question is narrower and more useful: what should change in your rules, filters, and risk settings when the external driver is moving faster than the index that reflects it.
What the last two weeks actually looked like
Pull the sequence together, because the sequence is the point.
Reported crude moves through late July 2026: Brent slipped below $100 around 24 July after a week that was still up roughly 13 percent on supply worries. Then it fell about 10 percent across two sessions as US–Iran peace talks were floated. On 27 July, Brent dropped nearly 4 percent to roughly $93 and WTI over 4 percent to about $85.60 after a pause in hostilities. On 29 July it jumped about 5 percent following reports of an intercepted attack. On 30 July it dipped back below $90, with Brent around $89.45 and WTI near $83.90. By 31 July it extended the fall toward $88.
Equities in the same window: Sensex and Nifty fell about 2.7 percent and 2.3 percent respectively in the week to 24 July, closing that Friday at 23,767.45 on the Nifty. GIFT Nifty pointed to a higher open the following Monday. By 30 July, mid-day reported an opening print of 77,540.55 on the Sensex (down 114.05 points, or 0.15 percent) and 24,225.90 on the Nifty (down 24.30 points, or 0.10 percent). On 31 July, GIFT Nifty was quoted near 24,450 against a previous close of 24,317, implying a gap-up of roughly 100 points.
The rupee ended one of those Fridays around 96.5625 to the dollar, with traders expecting a firmer open near 96.14–96.18 on softer oil and reported RBI measures to support the currency. FPIs, net sellers through the drawdown, turned net buyers as crude cooled.
So: index opens described as "flat" or "marginally low," inside a week where the index itself travelled well over 2 percent and its main macro driver moved 5 to 10 percent per session.
A flat open is not a calm market
Most retail systems read the open as a proxy for calm. It isn't. A flat open only tells you that overnight repricing netted out — not that variance is low.
Overnight variance and intraday variance are different problems
Two very different states produce a flat open:
- Genuinely quiet: low overnight range, low realised volatility, tight option premiums.
- Offsetting shocks: crude down 4 percent, US tech guidance strong, but rupee weak and bank earnings soft. Everything cancels at 9:15. Nothing cancels at 11:40.
Your entry logic usually cannot tell these apart, because it reads price, not the distribution behind price. Add a separate measure. Track the 5-day realised range of the index alongside the 5-day realised move of Brent or MCX crude. When the driver's realised volatility is elevated while the index's opening gap is small, you are in the second state — stored energy, not absence of energy.
The gap you did not get is still a risk you carry
Between 24 July and 31 July, Nifty travelled from a 23,767 close to roughly 24,317 and then into a signalled 100-point gap-up. Any overnight position through that window carried real gap risk — the fact that individual opens looked small does not mean any single overnight was safe. It means you were paid nothing extra for holding through a period when a headline could have gone the other way.
If your strategy holds overnight, this is a sizing question, not a signal question. If it is intraday, this is a first-30-minutes question: entries taken into a stored-energy tape need wider invalidation or smaller size, not the same fixed stop that worked in a quiet month.
Three channels that actually reach your P&L
Macro commentary is useless until you can name the path from headline to fill.
Crude to rupee to flows
The chain reported through this period is direct: higher crude widens India's import bill, pressures the rupee, complicates the inflation picture, and tends to coincide with foreign selling. Lower crude reverses it — and FPIs did turn net buyers as oil cooled. You do not need to model this. You need to notice that when the chain is live, index-level moves become flow-driven rather than earnings-driven, and flow-driven moves are trendier and less mean-reverting than what most retail intraday systems are built for.
Practical translation: mean-reversion logic on the index tends to face a harsher environment when the macro driver is directional. Not "it will fail" — but its historical hit rate was earned in a different mix of days.
Sector dispersion inside a flat index
A flat index is often a violently rotating index. Rising crude typically pressures oil marketing companies, paints, tyres, aviation and logistics on input-cost grounds, while upstream names read differently. When crude reversed 10 percent in two sessions, that dispersion reversed too.
This is where index-only context misleads a stock scanner. A clean breakout on a mid-cap logistics name looks identical on the chart whether the sector tape is supporting it or fighting it. Use the indices and sector heatmap view as a gate before acting on scanner rows — if the parent sector is the one absorbing the macro hit that day, that is a reason to reduce size or skip, not a reason to argue with the chart.
What headline risk does to option pricing
When resolution depends on a news event with a binary flavour — talks resume or they don't — implied volatility does not decay politely. Premium can hold up through a quiet session and then collapse on a single headline, or expand overnight with no warning from the previous close.
For option sellers, this is the dangerous part of a flat tape: theta looks like it is working, right until the driver moves 5 percent. For buyers, it is the opposite trap — paying elevated IV into an event that resolves toward the boring outcome. Neither is a call to act. Both are reasons to check whether your structure's worst case is defined before entry rather than discovered after it.
Turning context into rules your system can read
Reading news does not change anything unless it lands in a variable.
Tag the regime, do not forecast it
Do not try to predict crude. Tag the state and let the tag adjust risk. A workable three-state tag, computed once before the open:
- Calm: 5-day realised crude move under 3 percent, no scheduled macro event, rupee stable session-on-session.
- Elevated: 5-day realised crude move roughly 3 to 6 percent, or a live geopolitical headline in the last 48 hours.
- Stressed: 5-day realised crude move above 6 percent, or two consecutive sessions with moves over 4 percent in opposite directions.
Then bind risk to the tag, not to your mood: full size in calm, reduced size in elevated, and in stressed either paper-only or hedged structures only. The rule matters more than the exact thresholds — pick numbers you can compute the same way every morning and keep them fixed for a quarter before you touch them.
A pre-open checklist that takes four minutes
- GIFT Nifty versus previous close — is the implied gap larger than your average stop distance?
- Brent or MCX crude overnight percentage move and direction.
- USD/INR previous close and any RBI-related headlines.
- Overnight US and Asia close, plus any single-name guidance large enough to move a whole sector.
- Your own scheduled-event calendar: results, expiry, policy.
- Regime tag from the above, written down.
- Position book: what is already open, and what does today's tag imply for it?
Write the tag in the same place every day. A log you can look back on beats a feeling you cannot reconstruct.
What to re-check in your backtest before trusting it this month
A strategy validated on 2024–2025 data has probably not seen many sessions where the primary macro driver swung 8 percent and reversed.
Sample the right regime, not the whole history
Filter your backtest to the subset of days that match today's tag. If the sample is thin — say fewer than 30 comparable sessions — treat the metrics as indicative, not established. That is an honest limitation, not a flaw to hide. In options backtesting, this matters most for short-premium structures, where the entire edge lives in the tail you did not sample.
Cost, slippage and gap assumptions
Three assumptions quietly break in a headline tape:
- Slippage: wider spreads on gap-heavy mornings. If your backtest used a fixed one-tick assumption, re-run with two to three times that on elevated and stressed days and see whether the edge survives.
- Stop execution: a stop that triggers inside a gap does not fill at the stop. Model the fill at the open, not at the level.
- Cost: brokerage, STT, and impact do not shrink when volatility rises, but many backtests keep them flat as a percentage of a bigger move, flattering the result.
If the strategy only works when you assume calm-day execution, you have not built a strategy for this month.
Scanner discipline when the tape is headline-driven
Scanners produce more signals in volatile weeks, not better ones. Volume expands, ranges expand, and every noise bar starts looking like a breakout.
Two filters do most of the work:
- Freshness. A trendline breakout that fired 40 minutes ago in a fast tape is a different trade from one firing now. If the price has already travelled a meaningful multiple of your intended stop, the setup is gone even though the signal row still exists.
- Chase distance. Define a hard maximum distance from the trigger level beyond which the entry is simply blocked. This single rule removes most late-entry damage in a trending macro session.
If you use Anadi's Action Center, this is what the blocked-reason tags exist for — chase distance, invalidated price, stale signal. The point is not that a tool flags it; the point is that the decision was made before you were emotionally attached to the trade. Build the same gate manually if you trade off your own scanner.
Then validate: signal, freshness, chart with pattern geometry, volume confirmation, level structure, and only then a route into stock, futures or options. Skipping straight from signal row to order ticket is what a fast tape punishes hardest.
Risk settings that matter more than entry logic
In a week like the one just described, entry quality contributes less to outcomes than exposure control. Four settings worth checking:
- Daily loss limit. A hard number that flattens and stops the system for the day. If you have never hit it, it is probably set too wide to be a real limit.
- Per-trade risk. Fixed percentage of capital, computed from the actual stop distance, not a fixed lot count. Wider stops in volatile regimes must mean smaller size.
- Correlated exposure. Three long positions in three energy-sensitive sectors is one position with three brokerage bills.
- Manual override rules. Decide in advance the exact conditions under which you will intervene in a running algo — and write them down, because "it felt wrong" is not a condition.
More on structuring these in risk management, and if you want the macro context assembled for you each week rather than rebuilt every morning, the weekly market outlook is built for preparation, not trade calls.
Before you trade a flat open
A short checklist to run tomorrow:
- Compute your regime tag before the open and write it in the log.
- Compare the implied gap from GIFT Nifty against your average stop distance.
- Check whether your open positions are correlated to the same macro driver.
- Confirm your backtest has a meaningful sample of days matching today's tag.
- Re-run costs with elevated slippage if the tag is not calm.
- Verify the daily loss limit is armed and the number is one you would actually respect.
- Apply freshness and chase-distance blocks to every scanner row before routing an order.
- If the tag is stressed and your structure is undefined-risk, default to paper.
One caution on borrowed numbers. Published commentary during this period quoted support around 24,040–24,140 and resistance near 24,530. Those are someone else's levels from someone else's method. Hardcoding a level you did not derive is how a system inherits a stranger's assumptions — and their blind spots. Derive your own or use structure your rules can recompute daily.
Crude near $90 with a weak rupee is a risk environment, not a signal. The useful response is a tighter process: tag the regime, size to it, block late entries, and make sure the backtest you are trusting has actually seen days like today. If you want to build and test those filters inside a single workflow rather than across five browser tabs, you can request early access and set them up in a strategy builder before the next headline arrives.