Monday, November 9, 2026. Samvat 2083 is two days old, the Muhurat session on Sunday afternoon is already in the books, and Q2 FY27 results are still landing in batches across NSE and BSE filings.
If you trade manually, this is a week of headlines. If you run systems, it is a week of state management — because every one of those headlines is either an input your algo already handles, or an input it silently ignores.
This post is not about where the Nifty goes next. It is about the unglamorous work in between: which fields you store, which symbols you block, which assumptions in your backtest just broke, and which checks run before an order leaves your machine.
What the current tape actually says — and what it doesn't
Here is a useful exercise. Pull two market dashboards at two different moments and write down what each says.
MarketByte's daily orientation page showed a session with the Nifty 50 at 25,248.3, up about 0.5%, with 13 companies reporting Q2 FY27 results that day and 8 of them ahead of estimates. Domestic institutions were buyers, foreign investors trimmed, and the tape stayed range-bound.
The Economic Times markets dashboard, captured separately, showed Nifty 50 at 24,986.4 (down 0.18%), Sensex at 80,999.4, Nifty Bank at 58,850.65, and Nifty IT at 32,869.7 — with Nifty Smallcap 50 up 0.94% while large-cap banks were red.
Both are legitimate. They are simply different timestamps. And that is the first lesson of a news-heavy fortnight: a number scraped from a page is not live market state. It is a photograph.
Traders get hurt here in three recurring ways:
- A cached index level drives a regime filter that thinks the market is up when it is down.
- A "FII net sellers" line from yesterday's wrap gets treated as today's flow.
- An earnings "beat count" from one source disagrees with another, and the system has no tie-breaker.
The fix is boring and it works: every external data point your strategy consumes gets a timestamp, a source tag, and a staleness limit. If the value is older than your limit, the filter does not return "neutral" — it returns "unknown," and your system treats unknown as a reason to size down or stand aside, not a reason to proceed.
Earnings season is a calendar problem before it is a volatility problem
Most retail algos treat earnings as a volatility story. It is first a scheduling story.
Trackers like India Earnings Tracker build their calendars straight from filed board-meeting intimations — results announced today, through the week, and in the weeks ahead. That is exactly the shape of data a system needs: not sentiment, but dates attached to symbols.
Build the reporting-day blocklist first
Before you tune a single parameter, build a list of symbols with a scheduled result inside your holding horizon. Then decide, in writing, what happens to each:
- Intraday stock systems: block new entries on the reporting day and the session after. A gap you did not model is not an edge.
- Swing systems: block any entry whose planned hold crosses the result date, unless the strategy was explicitly designed and tested for event holds.
- Open positions: decide in advance whether you exit before the event, hedge, or reduce. Deciding at 3:15 pm on the day is not a rule, it is a mood.
- F&O overlays: check whether the stock has liquid options at all before assuming you can hedge. Illiquid stock options in an event window produce fills you will not enjoy.
Two concrete numbers worth tracking per symbol: days to next result, and whether the symbol sits in the current reporting batch. Both are cheap to store and they kill a surprising amount of avoidable damage.
"Beat estimates" is a comparison, not a verdict
MarketByte makes this point in its own explainer, and it is worth repeating because systems encode the confusion. A beat means the reported number came in above a consensus of analyst expectations. It says nothing on its own about guidance, margins, one-off items, or how much of the outcome was already in the price.
Which is why "8 of 13 beat estimates" is not a tradable input. It is context — a rough read on whether the reporting batch is coming in better or worse than the market expected, useful for deciding how much faith to put in your trend filters this week, not for picking a direction.
If you want to use it systematically, use it as a regime descriptor, not a signal: store the beat ratio, store the sector mix of who reported, and look at how your strategy behaved historically in similar batches. That is a research question for options backtesting and strategy logs, not a live discretionary call.
Turning a daily dashboard into machine-readable state
A "10-second market orientation" is designed for humans. Your system needs the same information as fields.
Five that carry their weight:
- Index level and change for NIFTY and BANKNIFTY, with capture time.
- Breadth and sector direction — which sectors led and lagged. In the snapshots above, IT did the lifting on one session while private banks dragged; on another, metals and energy carried the tape while defensives rested. A stock long in a lagging sector is a different trade from the same setup in a leading one.
- Flow direction — FII and DII net stance, with the caveat that it is a daily aggregate published after the fact.
- Reporting batch — count of companies reporting today, how many of your universe are in it, beat/miss ratio once available.
- Known calendar events — expiry, special sessions, holidays, policy dates.
Then write down the decision each field is allowed to influence. A field with no decision attached is decoration. A field influencing three unrelated decisions is a hidden single point of failure.
This is the same discipline behind a structured weekly market outlook: the point of reading context is to pre-commit to behaviour, not to generate opinions mid-session.
Calendar quirks that quietly break backtests
This fortnight has three of them, and all three distort historical testing if you ignore them.
Special sessions. NSE and BSE ran a Muhurat trading session on Sunday, November 8, from 2:20 pm to 3:30 pm, with MCX in the same window. That is roughly 70 minutes on a non-standard day. Any system that computes a daily bar, an ATR, a gap, or a session VWAP will treat that session as a full day unless you tell it otherwise. A 70-minute "day" compresses range, inflates some indicators and deflates others, and shows up in your equity curve as a phantom signal.
Check: does your data pipeline flag non-standard sessions? If not, add a session-length field and let strategies opt out of days below a minimum length.
Closing-session mechanics. ET's live coverage attributed part of one recent expiry-day move to volatility around the new closing auction session. Treat the mechanics as something to verify with your exchange and broker documentation rather than something to assume — but treat the implication as real now: if last-minute price discovery behaves differently than it used to, then any strategy that enters, exits, or marks positions in the final minutes is operating on changed ground.
Practical response: measure your own slippage in the last 15 minutes versus the rest of the session, this month versus earlier months. If the distribution shifted, your square-off window needs to move earlier or your orders need to become more passive. That is a measurement, not a prediction.
Expiry overlap with results. When a reporting batch lands in an expiry week, two independent volatility sources stack. Your position sizing needs to know both, which means your event calendar and your expiry calendar have to live in the same place.
Index context before stock and option entries
A clean stock setup in a weak tape is still a weak trade. This is where context earns its keep.
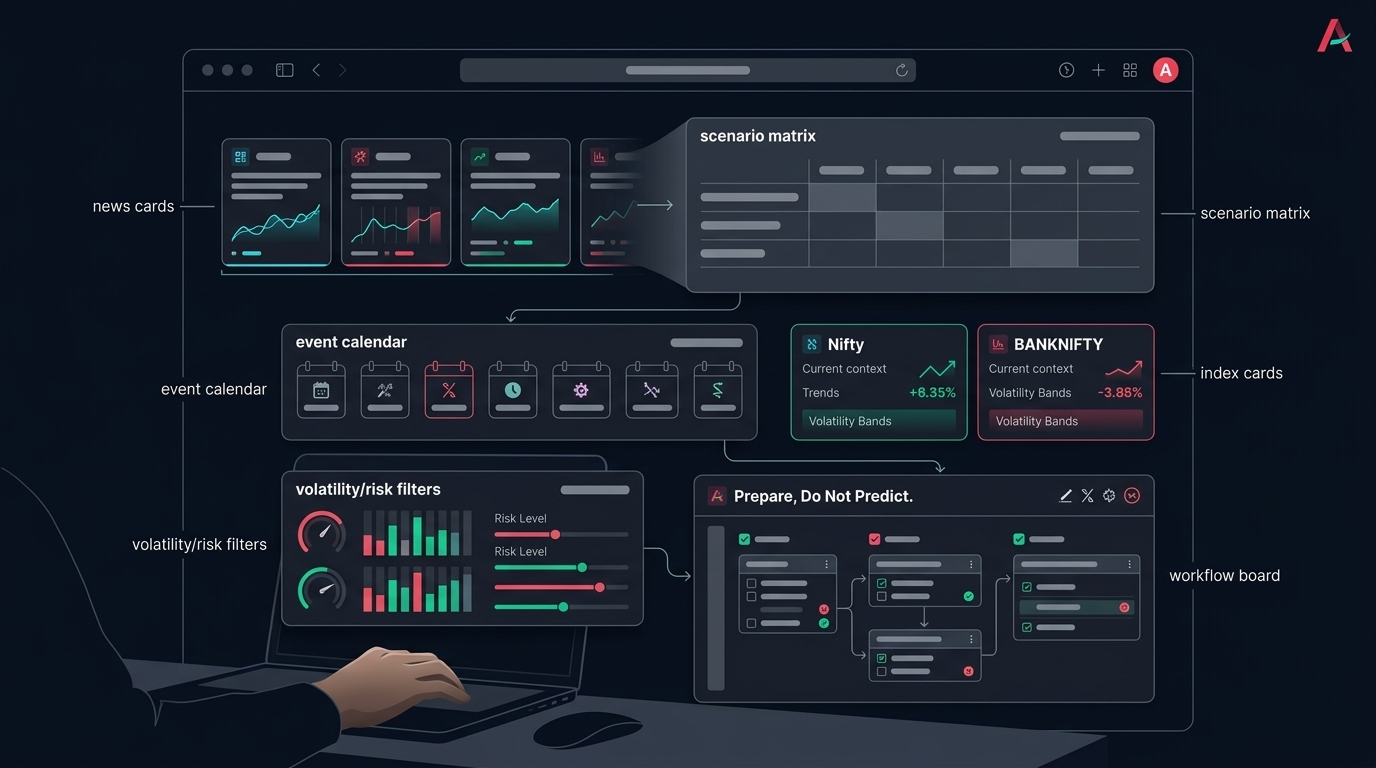
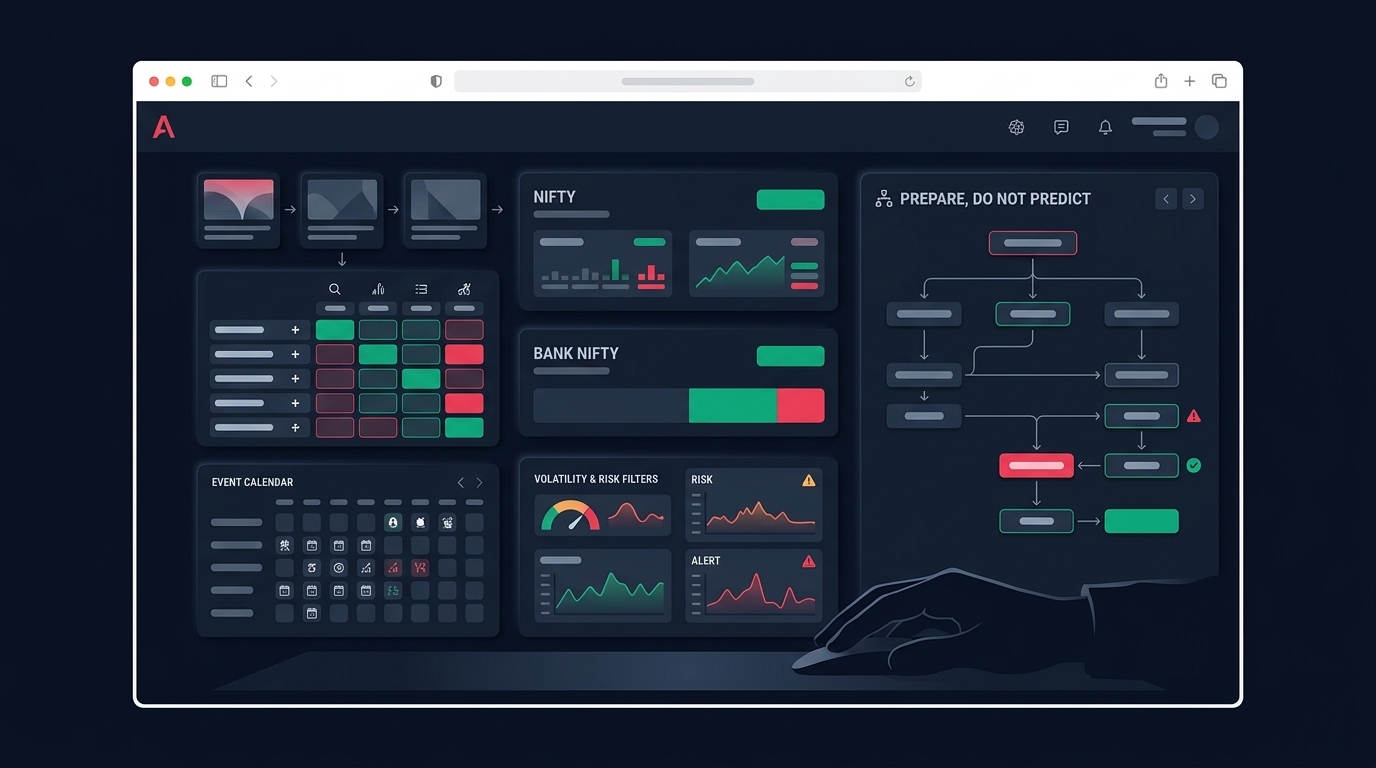
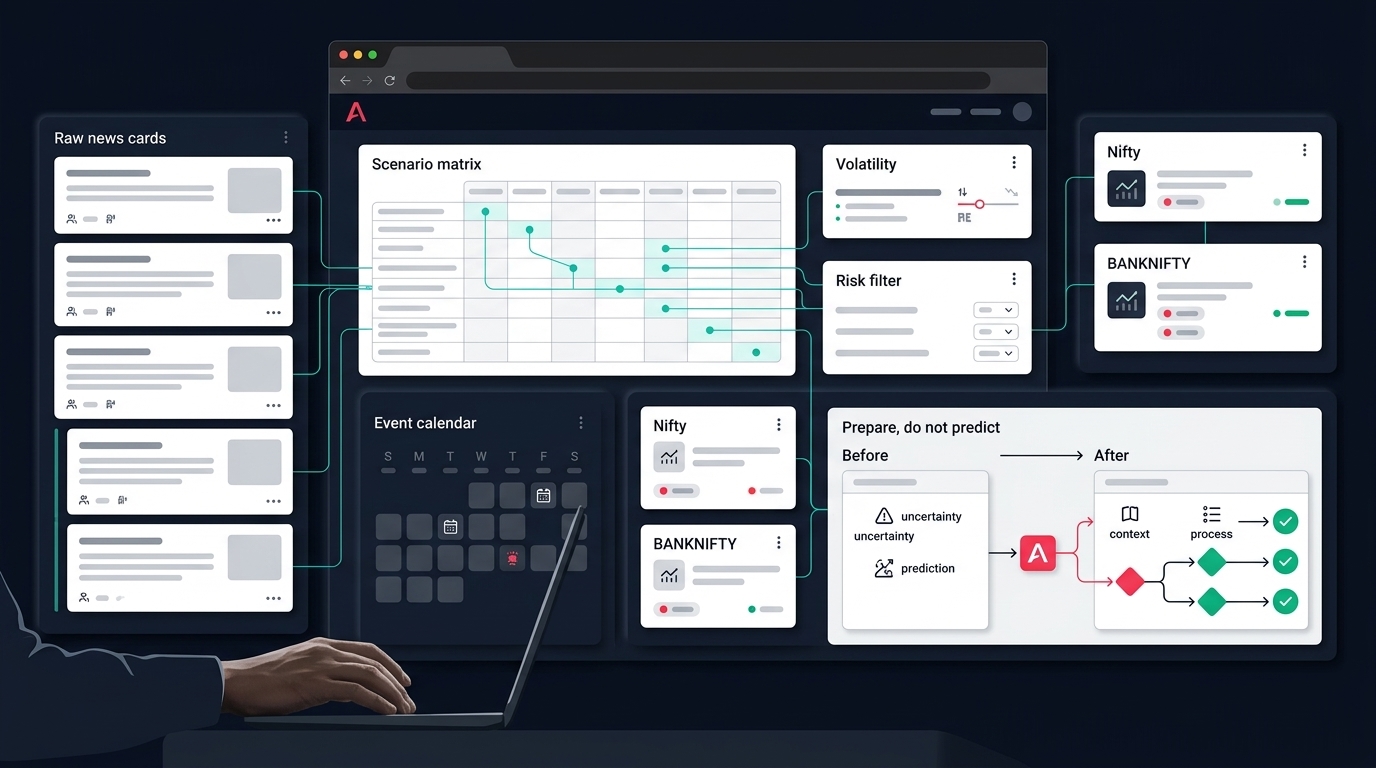
The sequence that holds up: index and sector context first, then scanner candidates, then instrument choice, then risk, then execution. Inside Anadi, that is index cards and the sector heatmap on the Indices page feeding the decision, rather than a scanner row acting alone.
A stock scanner in an earnings fortnight will produce more rows, not better ones. Volatility expands ranges, breakouts trigger more often, and false positives rise. So the filter layer matters more than the signal layer.
Anadi's Action Center exists for exactly this gap — it ranks scanner-backed candidates and shows signal freshness, generated levels, entry-blocked reasons, F&O eligibility, and route choice before anything reaches an order ticket. Blocked reasons like chase distance or invalidated price are the mechanical version of "that move already happened." In a week when gaps are common, that distinction is most of your edge preservation.
Options checks in an earnings and expiry window
If your workflow runs through options, the chain is where event risk becomes visible.
Before acting on a signal, the checks that matter are structural:
- Liquidity at the strike you actually want, not the strike near it. Spreads widen into events.
- IV context — is implied volatility elevated relative to its own recent range, and does your structure benefit or suffer if it contracts after the event? A long-premium structure held through a result and a short-premium structure held through the same result have opposite exposure to that contraction.
- Greeks at the basket level, not per leg. Two reasonable legs can combine into an unreasonable net position.
- Margin with existing positions considered — benefit estimates change when the rest of your book is included.
- Payoff preview before execution, not after.
Anadi keeps chain inspection, leg selection, basket preview, margin estimate, IV and theta views, and position follow-up in one options workspace for this reason: the expensive mistakes come from doing these checks in separate tabs and forgetting one.
None of this tells you what to trade. It tells you whether the trade you were going to place is the trade you think it is.
A workflow for the next two weeks
Pre-open
- Refresh index levels, sector leadership, and flow direction — with timestamps.
- Pull today's reporting list; cross-check against your tradeable universe.
- Flag expiry, special sessions, and policy dates on the calendar.
- Confirm broker API session is live and authenticated. A stale token on a gap day is the worst possible combination.
- Verify daily loss limit and max-positions caps are loaded in the engine, not just written in your notes.
Intraday
- Treat blocked-entry reasons as final, not advisory.
- Re-check that your data feed is updating; a frozen feed looks identical to a quiet market for about ten minutes.
- Log every rejected signal with its reason. This file becomes next month's research.
Post-close
- Record realised slippage, especially near the close.
- Note which symbols reported and how your system behaved around them.
- Update the reporting calendar for the week ahead.
Most of this can be codified rather than remembered. If you are building the rules themselves, a no-code strategy builder plus hard risk management limits will get you further in an event week than any amount of chart reading, and running new logic through paper trading first costs you nothing except patience. If you want to set this workflow up end to end, you can request early access and build the calendar and filter layer before the next reporting batch.
The takeaway checklist
- Timestamp every external data point; treat stale as unknown, and unknown as a reason to reduce risk.
- Keep a symbol-level results calendar with explicit rules for entries, holds, and exits.
- Read "beats estimates" as context about expectations, never as direction.
- Flag non-standard sessions in your data so Muhurat-type days do not pollute indicators and backtests.
- Measure your own closing-window slippage rather than assuming last year's behaviour still holds.
- Require index and sector context before acting on a single-stock or option signal.
- Validate strike liquidity, IV context, basket Greeks, and margin before execution — in that order.
- Log rejected signals. The trades you did not take are data.
Earnings seasons do not reward sharper opinions. They reward systems that already know what they will refuse to do.