Monday, 5 October 2026 closed red on the headline indices, but the direction was the least interesting part of the session. The shape of the move was what mattered: a modest index decline, a sharp jump in India VIX, and one sector pulling hard in the opposite direction.
That combination — small price move, big volatility move, wide sector dispersion — is exactly the tape you get as an Indian earnings season warms up. It is also the tape where most retail algos quietly start bleeding, because their filters were built for trending days and tested on averages.
This post is not a view on where the market goes next. It is a process post: what the 5 October numbers tell you about regime, which filters deserve a look before the results calendar thickens, and what to check in your scanner, option chain, and backtest before you let a strategy run through an earnings-heavy fortnight.
What the 05 Oct 2026 tape actually showed
As reported on Economic Times' live market page for the session:
- Nifty 50: 22,421.95, down 198.50 (-0.88%)
- BSE Sensex: 71,909.70, down 570.59 (-0.78%)
- Nifty Bank: 54,450.75, down 182.31 (-0.33%)
- Nifty IT: 28,304.70, up 599.91 (+2.17%)
- Nifty Midcap 50: 16,840.35, down 188.36 (-1.11%)
- Nifty Smallcap 50: 9,534.70, down 98.25 (-1.02%)
- Nifty 500: 21,857.75, down 214.35 (-0.97%)
- Nifty 100: down 0.92%; Nifty 200: down 0.94%
- BSE Bankex: 61,356.13, down 369.12 (-0.59%)
Separately, market summaries for the session noted that India VIX climbed about 7.15% while both Nifty 50 and Sensex closed lower, with volatility spiking versus the previous day. On the valuation side, Nifty 50 was showing a trailing EPS around 1,168 with a PE near 19.2, PB near 2.8, and dividend yield near 1.2 — numbers that move daily and get revised as results come in, so treat them as a reference point, not a fact to hardcode.
Treat every figure above as reported data for one session. Exchange and vendor numbers get revised, and your own broker feed may differ slightly on close prints. The point is the pattern, not the decimals.
The divergence is the headline, not the loss
Nifty fell 0.88%. Nifty IT rose 2.17%. That is a spread of roughly 305 basis points between the benchmark and one heavyweight sector in a single session.
Meanwhile the broader market was weaker than the benchmark — Midcap 50 down 1.11% and Smallcap 50 down 1.02% against Nifty's 0.88%. Nifty Bank, usually the volatility engine, was the most resilient large piece at just 0.33% down.
So the loss was not broad-based panic. It looked like rotation: money leaving broader-market and selected large-cap names, concentrating into IT, with banks roughly holding. For a long-only stock scanner that ranks breakouts by momentum, a day like this produces a flood of signals in one sector and a pile of failed breakouts everywhere else.
A 7% VIX jump on a 0.88% down day
This is the part worth sitting with. A 0.88% index decline is an ordinary day. A 7.15% VIX jump is not an ordinary reaction to an ordinary day.
When implied volatility rises faster than realised movement justifies, the usual reading is that participants are paying up for protection ahead of something on the calendar — results, macro data, a global event — rather than reacting to what already happened. You do not need to know which event. You only need to know that option premiums got more expensive relative to the actual move, and that your strategies price risk differently in that state.
Practical consequences:
- Short-premium strategies look more attractive on paper exactly when gap risk is rising. Higher credit is compensation for something.
- Long-premium and debit structures get more expensive to initiate, and theta bites harder if the expected move does not arrive.
- Stop-loss distances calibrated on a low-volatility sample get hit by noise rather than by invalidation.
None of that tells you what to trade. All of it tells you that a fixed rule set, unchanged across volatility regimes, is making an implicit bet you never wrote down.
Earnings season is a calendar problem, not a view problem
Indian results season clusters heavily from mid-October into November, with IT typically reporting early and banks and broader names following. Individual company dates shift, so pull your own list from exchange announcements and your broker's corporate-action feed rather than trusting a static calendar from last year.
The mistake most retail algo traders make is treating earnings as a forecasting problem — trying to guess the reaction. The workable version is treating it as a calendar and exposure problem.
Build an event table before you build a filter
For every symbol your system can trade, you want four fields: result date, confirmed-or-tentative status, F&O eligibility, and whether the symbol sits in an index your other positions are exposed to.
That last field catches the silent risk. If you are short Nifty strangles and separately long three IT stocks, an IT-heavy reporting week concentrates your exposure in a way neither position shows on its own. The 5 October session — IT up 2.17% while everything else fell — is a small preview of how sector-specific that concentration can get.
A practical build: export your scanner universe, join it against a results calendar, and tag each symbol with days-to-event. Then your strategy logic can read that tag instead of you remembering it at 9:14 am.
Blackout rules versus size reduction
Two honest options, and they are not equivalent.
Blackout — refuse new entries in a symbol within N sessions of its result date, and flatten or hedge existing exposure before the event. Simple, auditable, and it costs you the occasional good trade. For overnight positional systems in single stocks, this is usually the defensible default.
Size reduction — allow entries but cut position size when days-to-event is small or when the volatility state is elevated. More flexible, harder to validate, and it only works if your sizing is genuinely mechanical rather than discretionary.
Whichever you pick, write the rule as a number. "Avoid entries in a stock within two sessions of its scheduled result; if already in a position, reduce to half size or add a defined hedge" is testable. "Be careful around earnings" is not.
Turning the context into filters you can actually test
Volatility-state gates
Instead of a single VIX threshold, use state buckets and a rate-of-change condition. A session where VIX rises 7% is different from one where VIX sits at the same absolute level after drifting there over two weeks.
Reasonable things to gate on, each measured against your own historical sample rather than a number you read somewhere:
- India VIX percentile over a trailing 60 to 120 sessions
- One-day VIX change, with a separate branch for jumps above roughly 5 to 7%
- Realised-versus-implied gap: ATR-based realised move against current implied
- Index ATR percentile, so your stop distances scale with the regime
The output should not be "trade or don't trade." It should be a regime label that your risk management rules read — allowed strategy types, max concurrent positions, stop multiplier, and daily loss limit for that label.
Breadth and sector agreement
On 5 October, broader-market indices underperformed the benchmark while one sector led. A momentum scanner with no breadth check would have fired long signals into a market where most stocks were falling.
Two cheap filters that would have changed behaviour:
- Benchmark-versus-broad spread. If Midcap and Smallcap are both weaker than Nifty by a meaningful margin, downgrade long breakout conviction or require a higher entry-quality score.
- Sector agreement. Require the candidate's sector index to be in the same direction as the signal. An IT long on 5 October passes. A midcap industrial long does not.
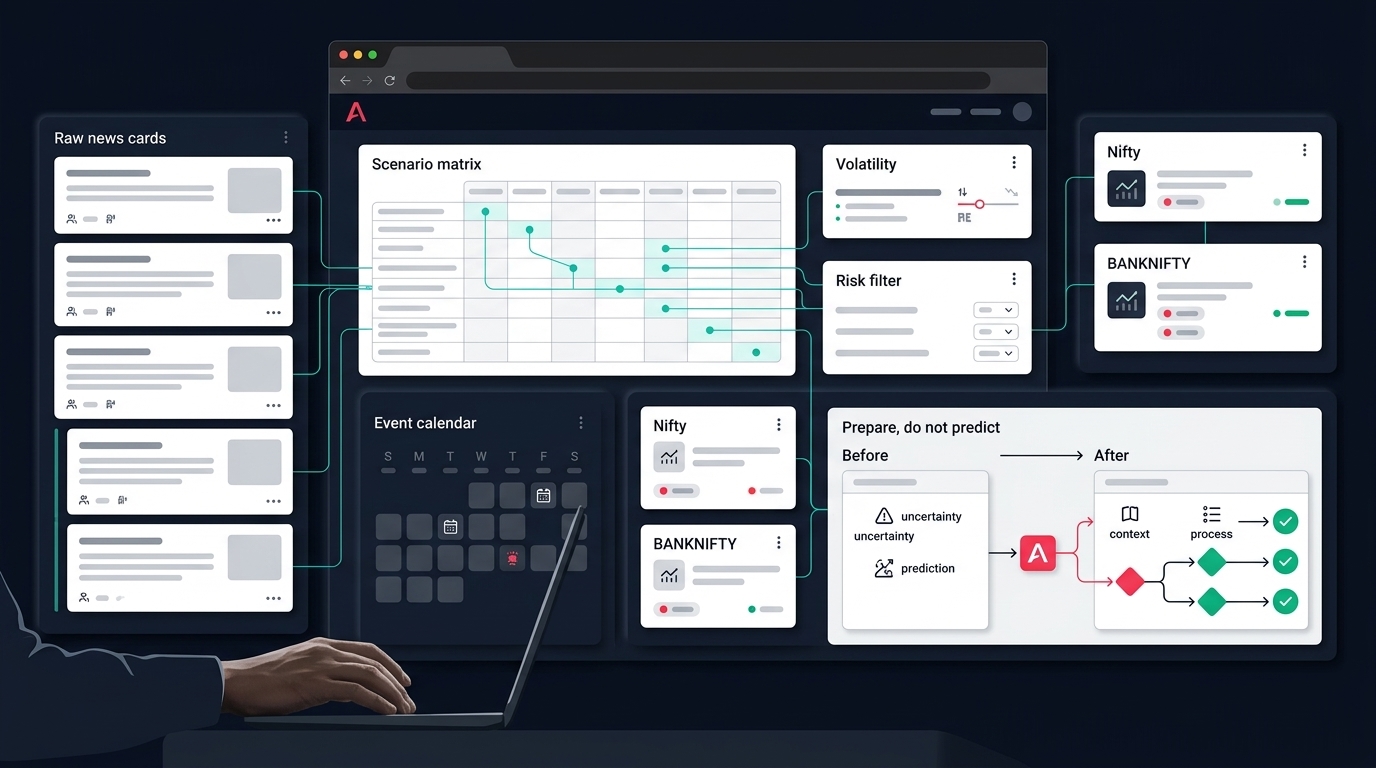
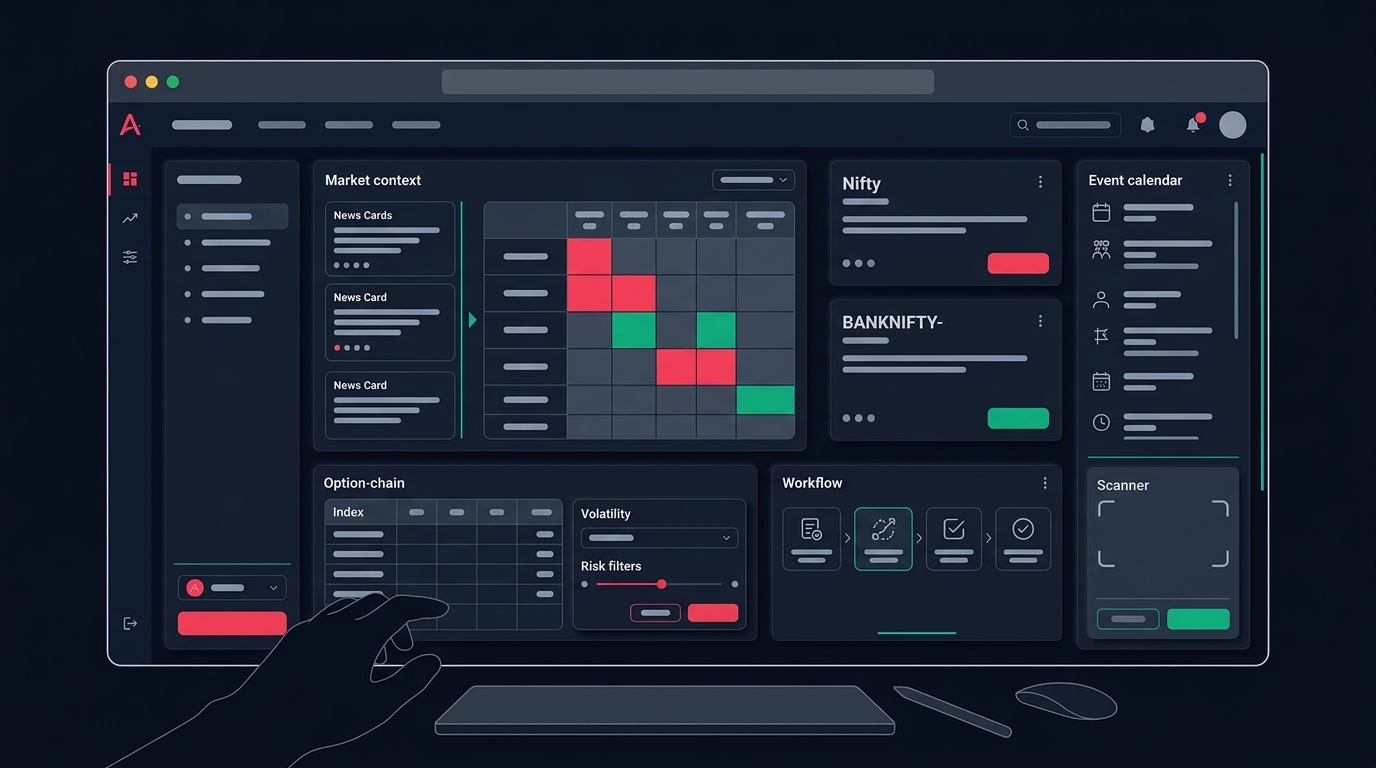
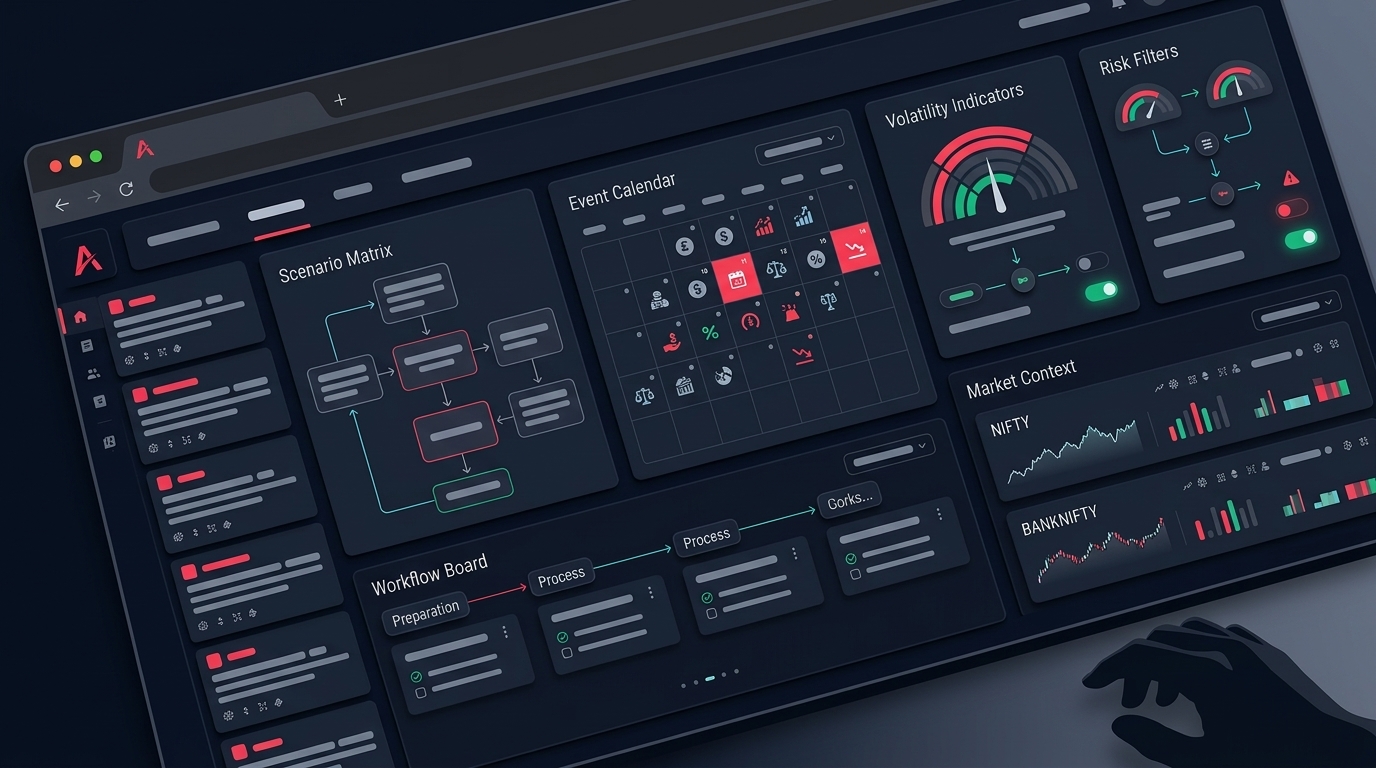
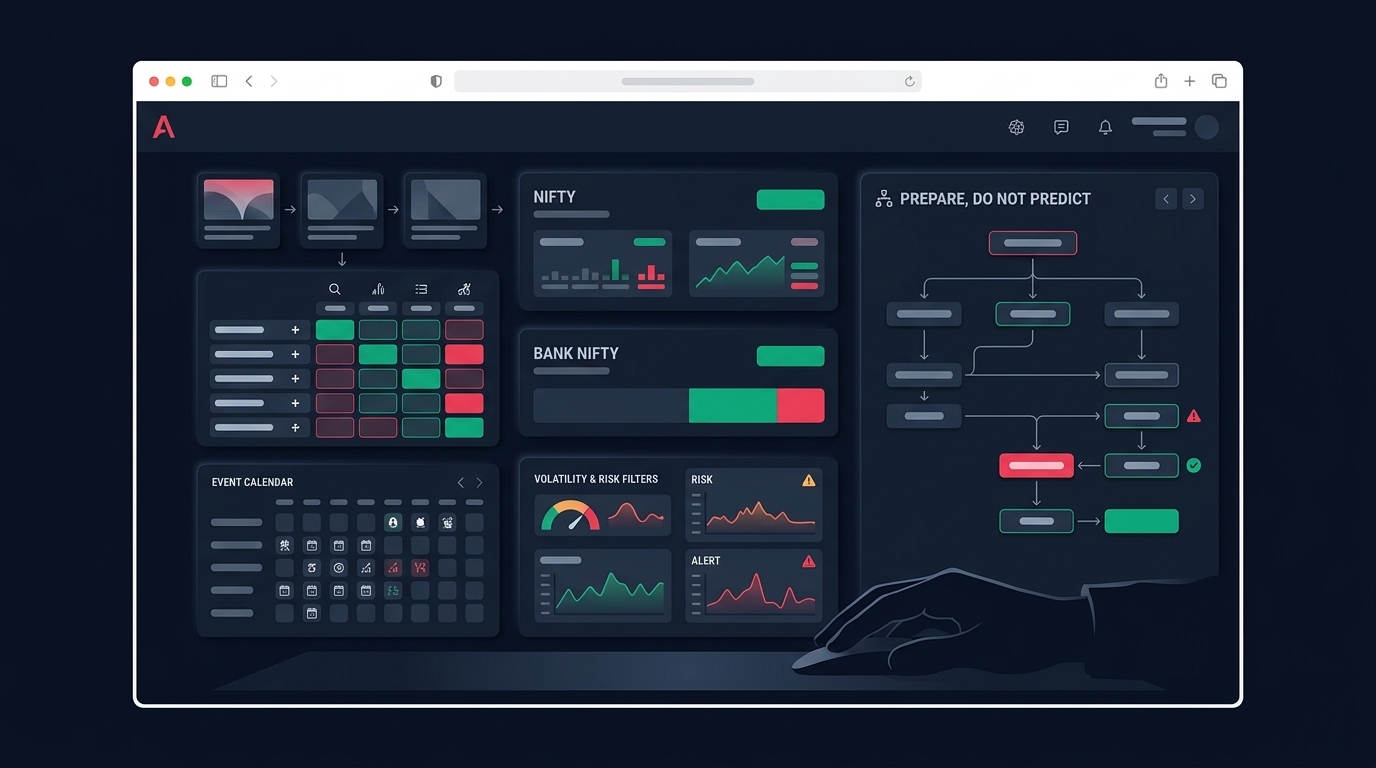
This is what the stock scanner output needs before it becomes an order — not more signals, fewer and better-qualified ones. In Anadi, the Indices view with index cards and a sector heatmap exists for exactly this sequencing: market context first, then symbol selection. The Action Center layer then ranks scanner-backed candidates and shows blocked reasons such as chase distance or invalidated price, so a late entry into a crowded sector gets flagged rather than filled.
Gap and slippage assumptions
Earnings reactions are gap events. If your backtest assumes fills at the next candle's open with no slippage, it is modelling a market that does not exist on result mornings.
Minimum adjustments before trusting an earnings-season backtest:
- Model slippage as a percentage of ATR, not a fixed paisa value
- Assume stops execute at the gap price, not the stop price
- For options, widen the assumed spread on non-liquid strikes rather than using mid-price fills
What to check in the option chain on a high-IV, low-direction day
When volatility jumps without a large price move, strike selection changes risk profile more than entry price does. A few things worth validating before any structure goes live:
- IV levels by strike, not just the headline. Skew shifts around events; the strike you picked from a template may be pricing a different scenario than the one you have in mind.
- Liquidity at your specific strike. Open interest and bid-ask spread at the exact contract, on the exact expiry. A strategy that works on the ATM strike can be unmanageable three strikes out.
- Theta and vega exposure of the whole basket, not leg by leg. Multi-leg structures net out in ways that single-leg intuition misses.
- Margin with existing positions considered, before you place the order. If a hedge leg fails to fill, what does the margin requirement become?
This is the argument for keeping chain inspection, basket preview, margin estimate, and risk budget in one workflow rather than across four tabs. Anadi's options workspace is built that way — setup, chain, OI analysis, strategy finder, IV/theta, hedge desk, and manage-positions tabs for NIFTY, BANKNIFTY, FINNIFTY, and MIDCPNIFTY — so the risk and margin numbers appear before execution, not after.
What this means for your backtests
Earnings season breaks backtests in a specific, predictable way, and most retail traders discover it live.
If your sample period skips a heavy results window, your drawdown estimate is too low. If it includes one and your strategy survived, you still have a sample size of one — which is a story, not evidence.
Three things worth running:
- Regime-tagged performance. Split results by volatility state. If the strategy makes all its money in low-VIX stretches and gives it back in high-VIX ones, you have a regime-selection problem, not an entry-logic problem.
- Event-day sensitivity. Run the strategy twice: once including result-date sessions, once excluding them. A large gap between the two tells you how much of your edge or your damage is event-driven. Excluding them to make the curve look better is self-deception — do it to measure, then decide the live rule.
- Walk-forward across at least two results seasons. One season of good numbers from a parameter set tuned on that season is the textbook overfit.
Honest options backtesting here means accepting that some questions your sample cannot answer. That is a better position than a clean equity curve built on assumptions you never checked.
Checklist for the next earnings-season session
Before the open:
- Pull the results calendar for your traded universe; tag days-to-event per symbol.
- Check India VIX level and one-day change; assign today's volatility label.
- Note benchmark-versus-broad spread — is breadth confirming or contradicting the index?
- Check which sectors are leading and whether your open positions cluster there.
- Confirm your daily loss limit is set for today's regime, not last month's.
- Verify broker session and API token validity before any automated run.
During the session:
- Require sector agreement on new scanner longs; downgrade or skip the rest.
- Honour blackout windows on single-stock entries near result dates.
- Scale stop distance with current ATR rather than a fixed value.
- Check margin with existing positions before adding any multi-leg structure.
After the close:
- Log the regime label alongside each trade so you can tag performance later.
- Note any order that filled far from its intended price, and why.
None of this predicts the next session. It makes your behaviour on the next session repeatable, which is the only thing you actually control.
If you want to build these filters as explicit rules rather than habits, a no-code strategy builder plus paper-mode execution is the low-risk way to test whether your volatility gate and event blackout survive contact with a live tape. You can request early access to run them in paper mode first, and a periodic weekly market outlook is worth reading as context for preparation — not as a source of trade calls.
One last thing about days like 5 October 2026. The index fell under 1%. Volatility jumped over 7%. One sector gained over 2%. Tape thoda confusing tha — and that is precisely the condition under which a trader with written rules and a trader with a hunch produce very different months.