If you open a live market page on a day like October 13, 2026, you get a wall of numbers and a stream of headlines. Nifty down. Crude up. FII selling. Earnings tracker. Rupee moving. Bond yields rising. Smallcaps green.
Most retail traders read that wall and feel informed. Very few turn it into anything their system can actually use.
That gap is the whole problem. A live-updates page is a news product, not a risk product. It is built to keep you reading, not to tell your strategy whether today's conditions resemble the conditions it was tested in. If your algo cannot answer that second question, the first one is entertainment.
This post walks through what the current tape actually showed, where the contradictions are, and how to convert all of it into filters, blackout windows and workflow checks. No calls, no targets, no view on direction.
What the tape actually showed
Here is the snapshot the feeds carried around this session, taken as-is from market data pages:
- Nifty 50: 22,363.35, down 157.11 (-0.70%)
- BSE Sensex: 71,924.68, down 547.65 (-0.75%)
- Nifty Bank: 54,918, down 0.61%
- Nifty IT: 28,349.6, down 0.79%
- Nifty 100: down 0.52%; Nifty 200: down 0.40%; Nifty 500: down 0.20%
- Nifty Midcap 50: 16,827.65, up 0.24%
- Nifty Smallcap 50: 9,698.35, up 1.55%
Read the first four lines and you have a risk-off day. Read the last two and you have a rotation day. Both are true at the same time, and that combination matters more than either half.
The headline index and the broad market disagreed
Large-cap indices fell between roughly 0.5% and 0.8%. Smallcap 50 rose 1.55%. The Nifty 500 fell only 0.20% — much less than the Nifty 50 — which tells you the drag was concentrated in heavyweights rather than spread across the market.
For a momentum scanner, this is the single most important fact of the day. A breadth-blind scanner will happily fire long signals in smallcaps while your index-level risk model says "defensive." You end up long the thinnest part of the market on a day the heavyweights are being sold.
That is not a prediction about what happens next. It is a structural observation: your stock-side signals and your index-side context were pointing in opposite directions, and your system needs an explicit rule for what to do when that happens.
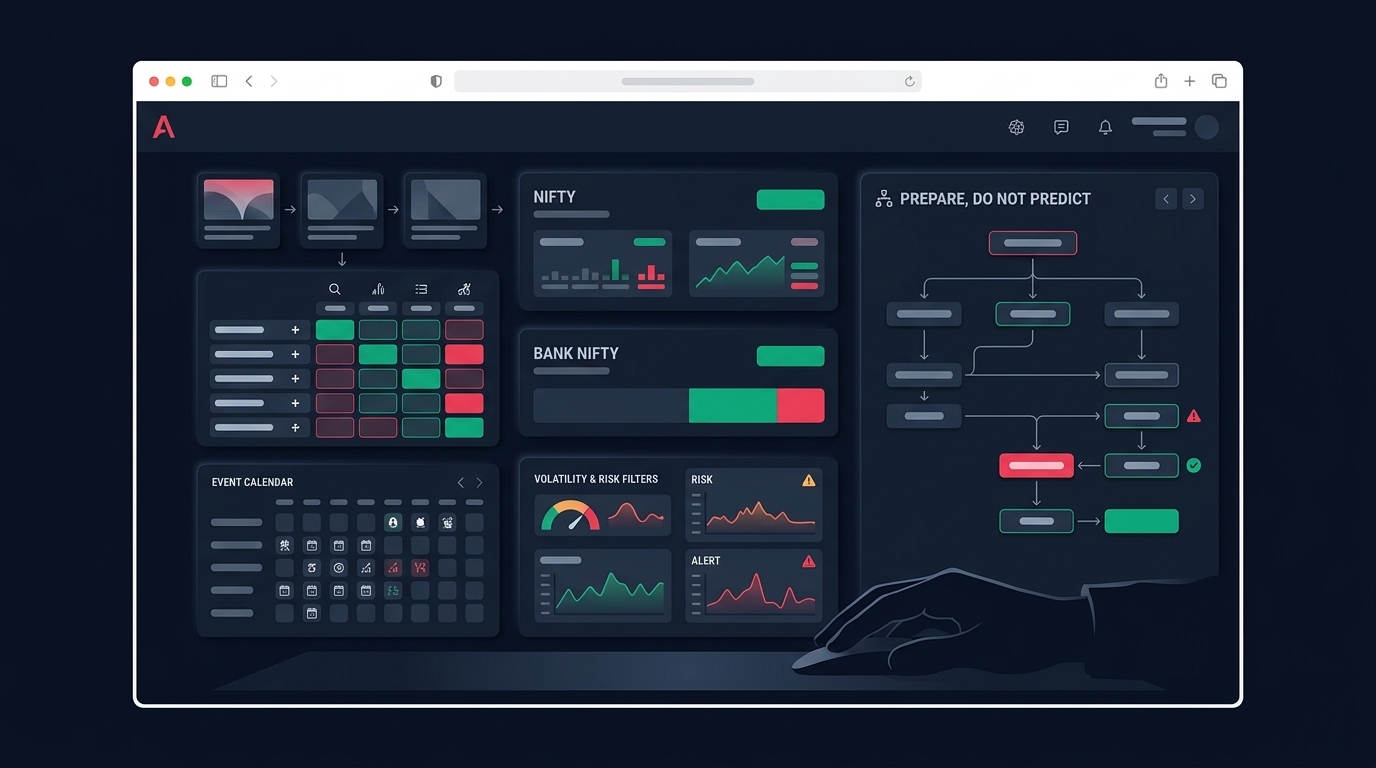
Anadi's Indices view exists for exactly this check — index cards plus a sector heatmap, looked at before you act on a scanner row, not after. The useful question is never "is the market up or down." It is "is participation confirming the setup I am about to take."
Flows cut both ways
The reported flow numbers from a comparable session: FIIs sold about Rs 1,708 crore, DIIs bought about Rs 3,045 crore. Net institutional money was positive, yet the index closed lower.
This is a common and underappreciated state. Domestic buying can absorb foreign selling in aggregate while prices still fall, because flow data is a daily net and price is a path. Traders who use "DII buying" as a bullish filter are using an end-of-day aggregate to justify an intraday decision. The data arrives after your trade is closed.
If you want flows in your process, use them as a slow-moving regime variable — a weekly or ten-day rolling net — not as an intraday trigger.
Earnings season changes the shape of risk, not just the size
The earnings tracker in the research is the most actionable item on the page: roughly 129 companies scheduled to report Q2 results in a single week, including HDFC Bank, HCL Tech and Wipro.
That is not "volatility." That is a calendar of scheduled, known-in-advance single-stock gap events, several of them in index-heavyweight names.
The distinction matters because the two risks need different handling:
- Index-level volatility is managed with position size, stop width and exposure caps.
- Single-stock event risk is managed with avoidance. You cannot size your way out of an 8% results gap on a stock you are holding overnight with a 1.5% stop.
Nifty IT falling 0.79% in a week when HCL Tech and Wipro report is a reminder that sector-level pre-positioning ahead of results is a crowded, reflexive trade. Your backtest, which saw those dates as ordinary trading days, has no idea.
Build a results calendar blackout
The practical version of this is boring and effective. Maintain a list of result dates for every symbol in your trading universe, then apply rules:
- No new swing entries in a symbol from T-2 sessions to results, where T is the announcement date.
- No overnight carry into results for stock positions, regardless of profit.
- Intraday only, reduced size on results day and the session after, when spreads and gaps are widest.
- Sector caution when two or more heavyweights in the same sector report in the same week — correlated gaps break the diversification your position sizing assumed.
- Re-enable normally two sessions after the print, once the gap has been absorbed into the price structure.
These are not clever rules. They are the kind of rules that separate a strategy with a 40-session drawdown from one with a 4-session drawdown, and they cost nothing to implement in a strategy builder as a date-based condition.
Why your scanner needs blocked-entry logic, not just signals
During earnings weeks, scanners produce more signals, not fewer. Gaps create breakouts. Volatility creates range expansions. Half of those signals are events your system was never designed to trade.
This is where a filter layer between discovery and execution earns its place. Anadi's Action Center ranks scanner-backed candidates and shows entry quality, freshness, and explicit blocked reasons — chase distance, invalidated price, stale signal — along with F&O eligibility and route choice. The point is not that the tool is clever. The point is that a signal and a tradeable signal are different objects, and your workflow should make the difference visible before capital moves.
A stock scanner that outputs 40 rows with no blocking logic is a to-do list written by volatility.
Conflicting feeds are the norm — design for state, not story
Here is something worth sitting with. Within the same body of market coverage around this period, you can find:
- A report citing "rising bond yields and rupee weakness" as drivers of the decline.
- Another report noting the rupee strengthened 96 paise, its largest gain in six months.
- One session attributed to "geopolitical tensions" and volatile crude.
- Another describing a sharp sell-off on an oil price spike and institutional outflow fears.
- A reference to Nifty touching a 52-week low near 22,179 in a tightening-driven sell-off.
These are different days, different windows, different writers. None of them is lying. But if you build your rules by reading narratives, you will build a system that flips its stance every time the byline changes.
The fix is to stop consuming market context as story and start consuming it as state. A state is something you can evaluate the same way twice:
- Crude: above or below a defined threshold, plus the 5-day change.
- Rupee: 5-day direction, not today's headline.
- India VIX: current level versus its own 20-day range.
- Breadth: advance-decline, plus large-cap index return minus Nifty 500 return.
- Sector dispersion: how many sectoral indices are positive.
- Event density: number of index-constituent results in the next three sessions.
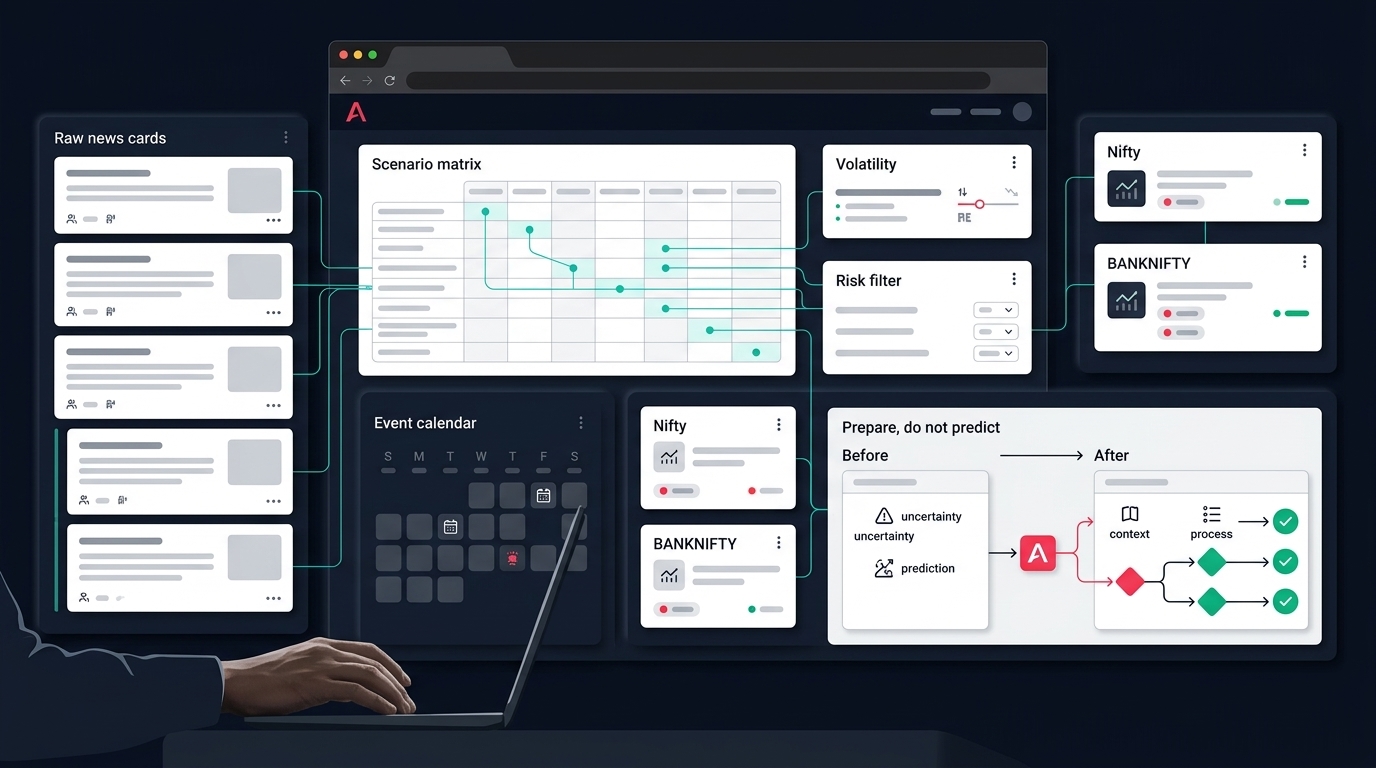
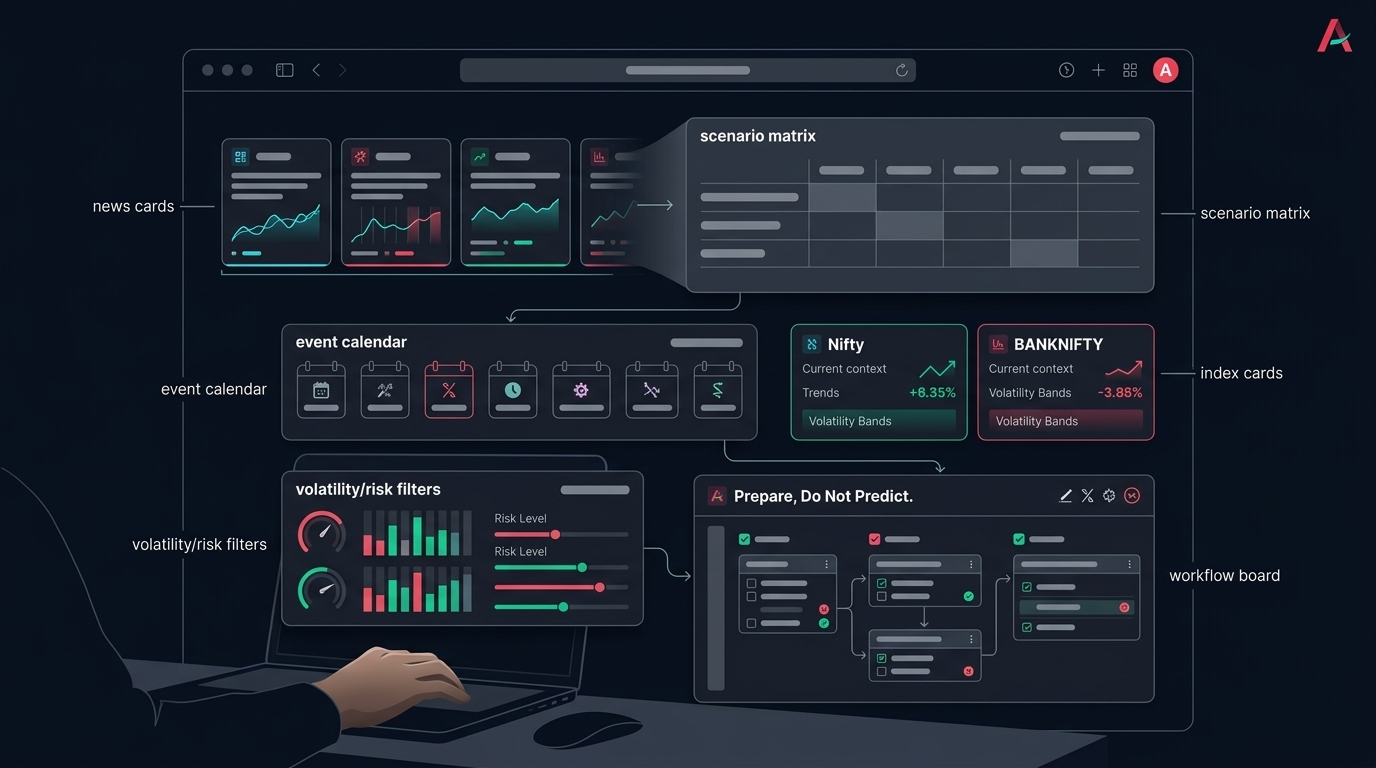
Six numbers. Each one either inside or outside a band. Your strategy reads bands, not headlines. The feed becomes an input, not an influence. A structured weekly market outlook works the same way — it is for preparation, not for chasing whatever moved yesterday.
Option structure deserves its own check
The valuation context in the data — Nifty PE around 19.1, PB around 2.8, dividend yield around 1.5, trailing EPS near 1,169 — tells you nothing about tomorrow. What it does tell you is that earnings season is the period when the E in that ratio gets repriced across 129 companies in a week.
For options traders, that translates into one question: is implied volatility rich or cheap relative to what is actually scheduled to happen?
Buying premium into a known event when IV has already expanded is one of the most reliable ways to be directionally right and still lose money. Theta drag plus post-event IV collapse can take out a favourable move in the underlying. Selling naked premium into the same event is the mirror-image mistake with a fatter tail.
Anadi keeps IV & Theta as a tab inside the options desk — beside the chain, OI analysis and strategy finder, not as an afterthought — because structure selection should happen before strike selection. Defined-risk spreads, calendars and hedged structures behave very differently across an IV expansion and contraction cycle, and the right answer changes week to week.
If you trade option structures around events, test them properly. Options backtesting that treats expiry weeks, results days and IV regimes as ordinary sessions will overstate every premium-selling strategy you own.
Check these in your backtest before trusting this week's signals
Run through this list against your own test results, honestly:
- Did your test period include a comparable regime? A system validated across 2023-2025 has limited evidence about weeks where heavyweights fall while smallcaps rise 1.5%.
- Are gaps modelled or smoothed? If your backtest fills at the previous close or ignores overnight gaps, your drawdown estimate is fiction during earnings season.
- What is your slippage assumption in smallcaps? The 1.55% Smallcap 50 move came with real spread costs. Flat 0.05% slippage across all symbols is optimistic for anything outside the liquid F&O universe.
- How many trades does your edge rest on? If removing the ten best trades turns the equity curve flat, you have a sample, not a strategy.
- Does your drawdown rule exist in code? A daily loss limit you intend to honour is not a limit. Define it, wire it, and let it close the day.
Run the next two weeks in paper trading if your system has never faced a dense results calendar. The cost of that patience is zero. The cost of skipping it is a live-money education.
If you want to build this kind of state-based preparation into your workflow rather than reading dashboards every morning, you can get early access and set the filters up once.
The checklist
Pin this somewhere you will see it before the open:
- Index context first. Large-cap return, broad-market return, and the gap between them. Note whether participation confirms or contradicts your signals.
- Event density second. Count index-constituent results in the next three sessions. High count means reduced size and no overnight carry.
- Blackout list applied. Every symbol reporting within two sessions is off the new-entry list, no exceptions for good-looking charts.
- Volatility state logged. India VIX level versus its own 20-day range, written down, so next week you have a comparison point.
- Macro as bands, not stories. Crude, rupee and yields reduced to inside-or-outside thresholds. Never re-read a headline to decide a trade.
- Structure before strike. For options, decide spread-versus-outright from the IV state first.
- Blocked reasons respected. If the workflow flags chase distance or stale signal, skip it. Overriding a filter once is how risk management quietly becomes optional.
- Loss limits in code. Daily and weekly caps enforced by the system, not by your judgement at 2:40 pm.
None of this predicts where Nifty goes. That is the point. Market context is for deciding how much risk your process is willing to carry, which setups are temporarily off the table, and which assumptions in your backtest are being tested in real time.
The traders who struggle during earnings season are rarely the ones with a weak strategy. They are the ones who let a live-updates page replace a rulebook.