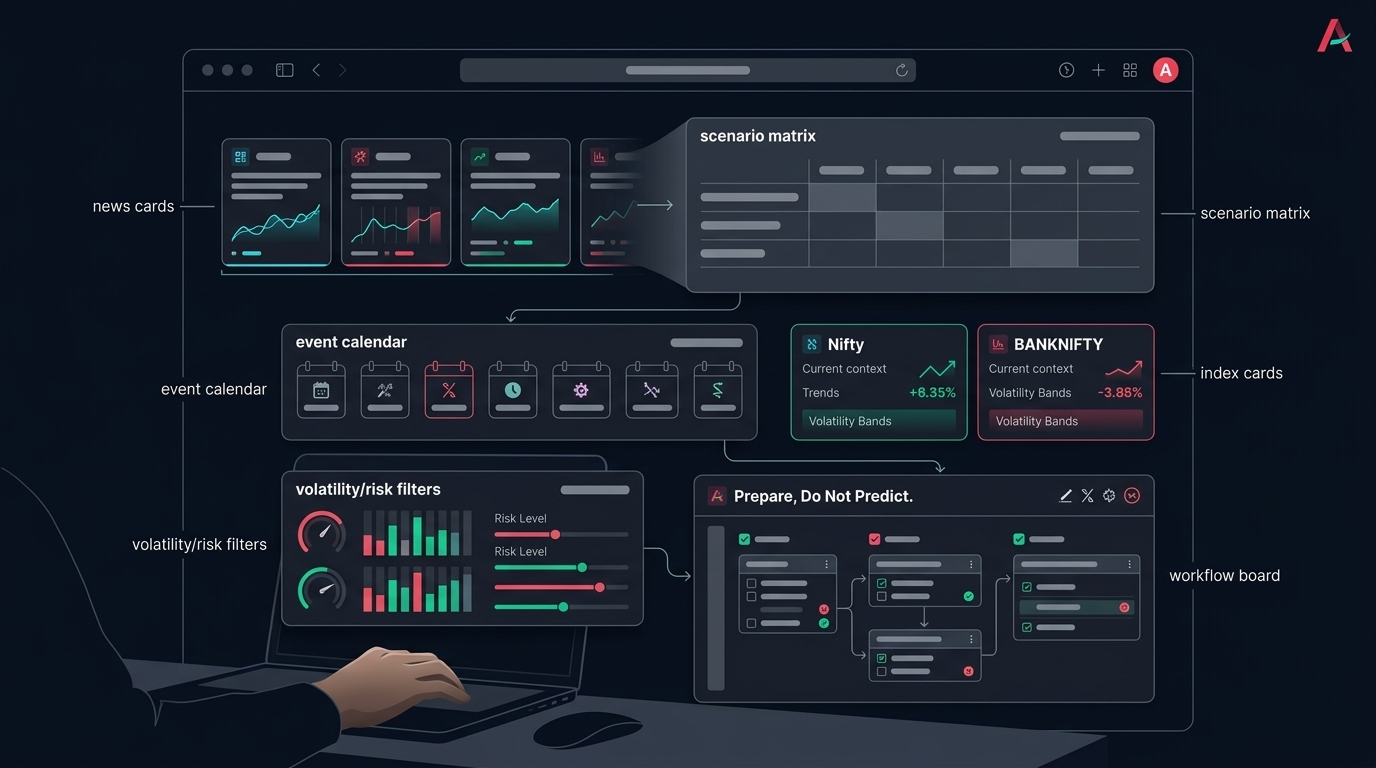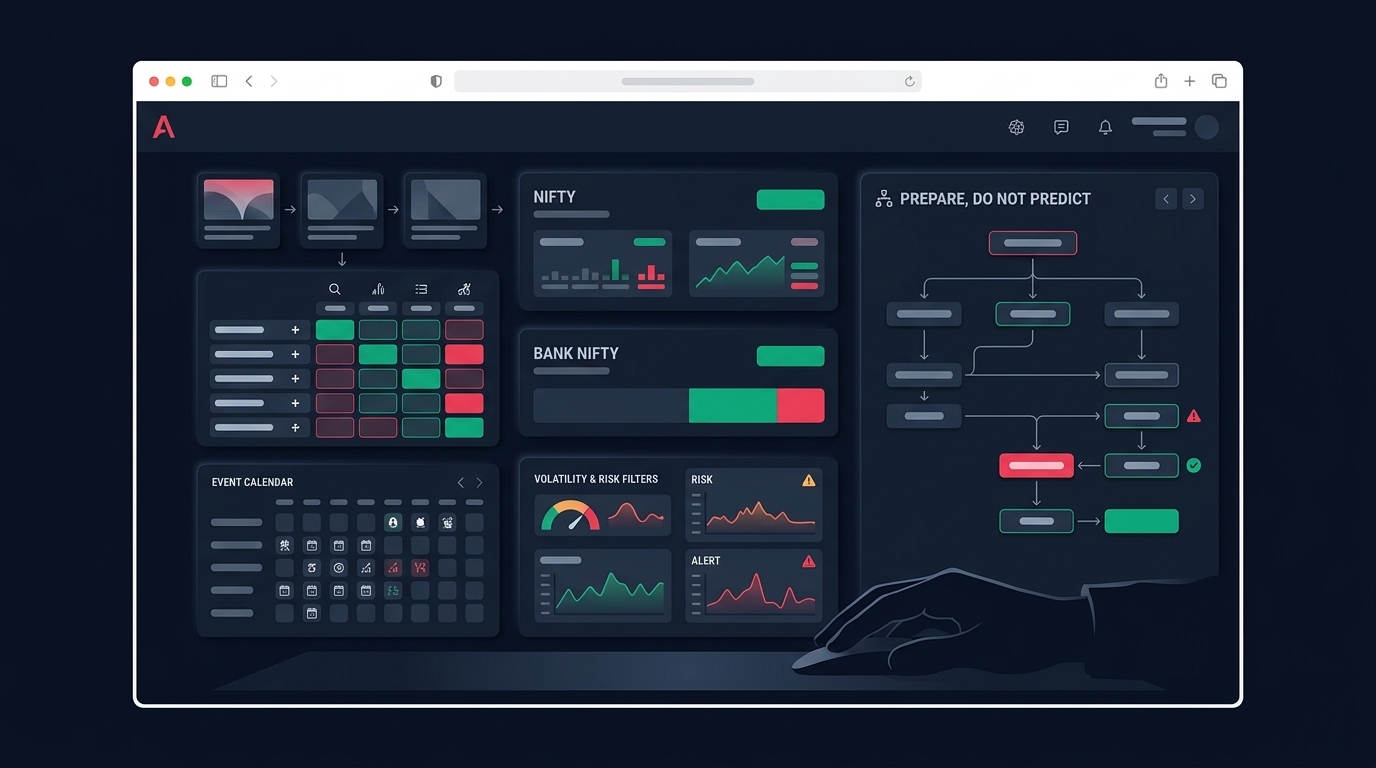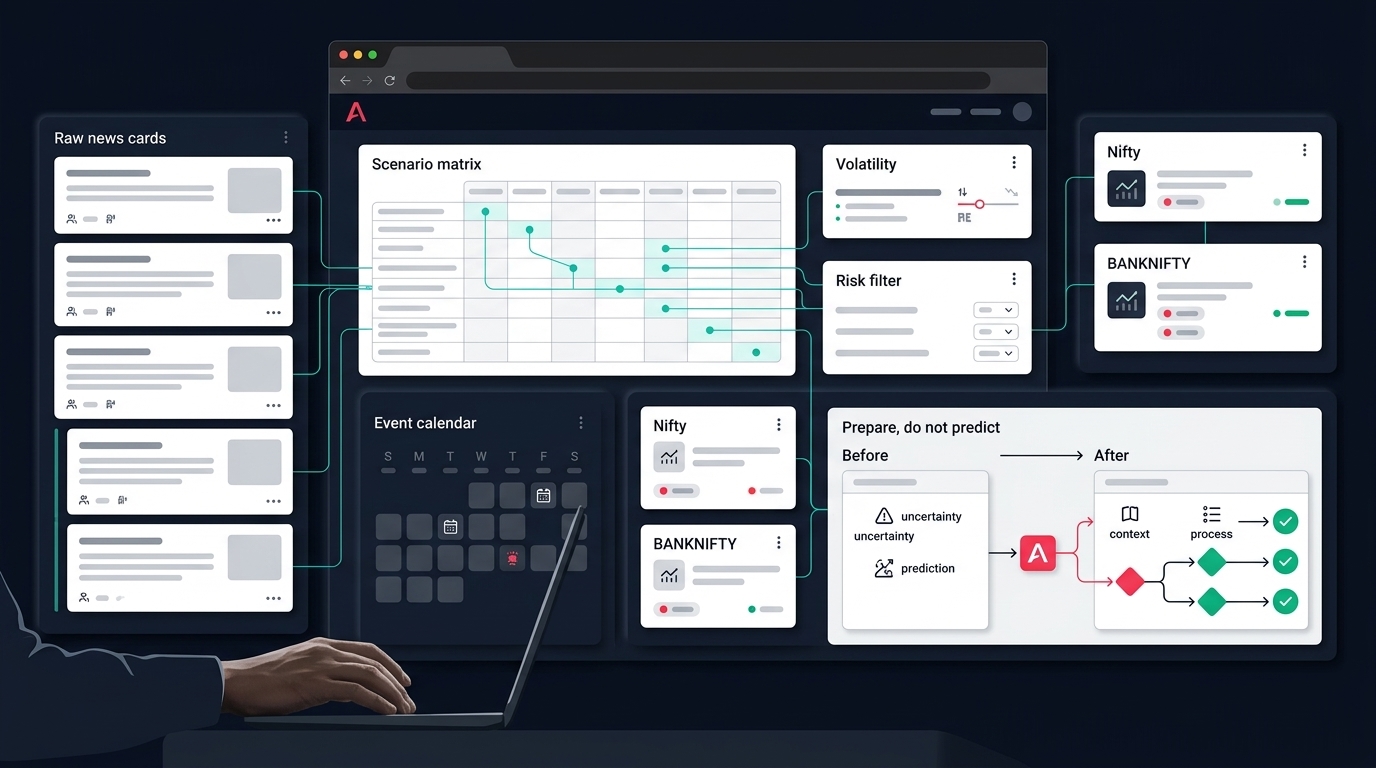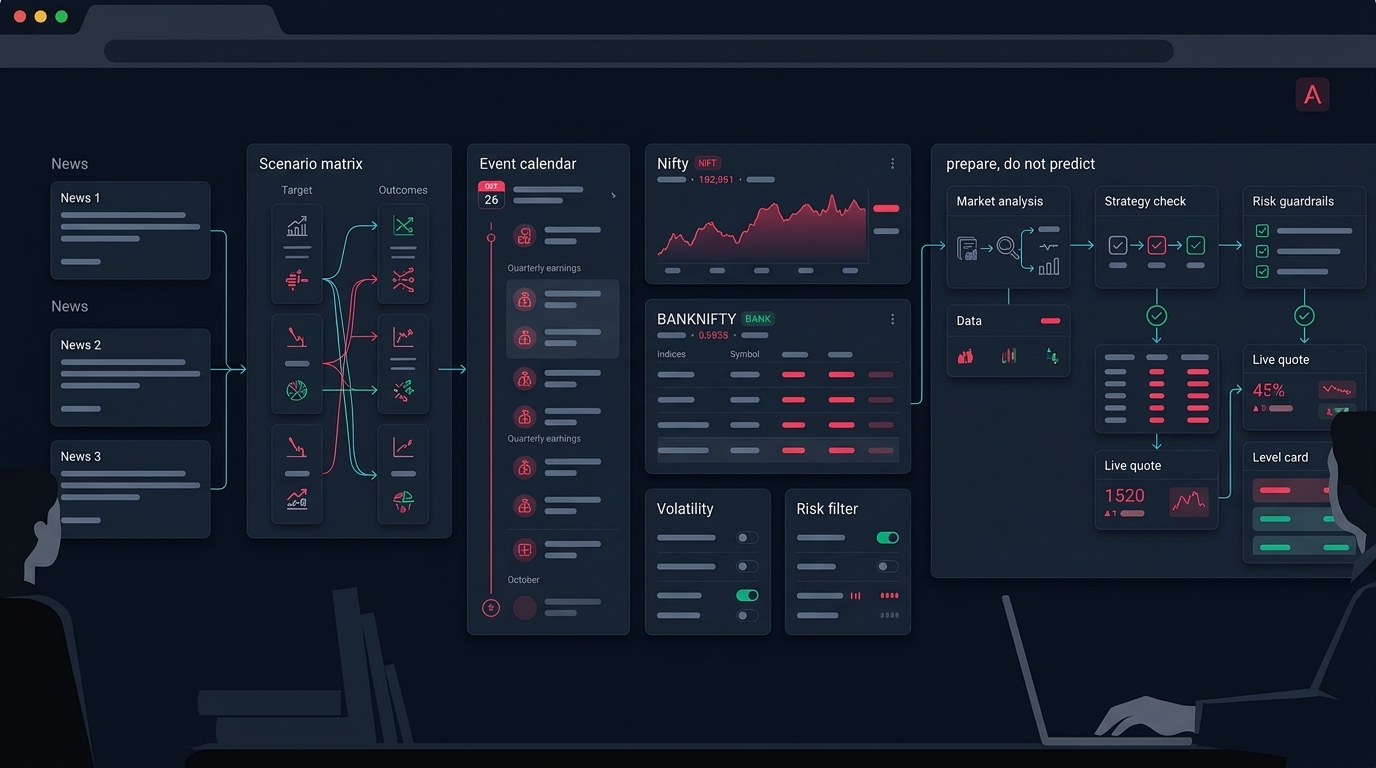
Late October is the loudest part of the Indian earnings calendar. The July–September quarter — Q2 FY27 — is reported through October and into November, which means on any given session a dozen or more listed companies are filing results, several of them index constituents.
If you trade manually, you feel this as "the market is choppy today." If you run an algo, you feel it as something more specific: a stop that gets hit on a 9:16 gap, a scanner that fires on a stock which reported after market hours yesterday, or an options position whose implied volatility collapses the moment a result lands.
Dashboards like MarketByte, which publish daily Nifty 50 results, movers, FII/DII flows and plain-English earnings summaries, exist to give you a fast orientation. Earnings trackers that aggregate revenue, net profit, operating profit and EPS for 1,000+ NSE and BSE companies — with links back to the original filings — give you the structured version.
The useful question is not "what does the summary say." It is: which fields from this feed deserve to become rules in my system?
This post is about that conversion. No calls, no levels, no view on direction.
What an earnings feed actually gives you
Strip away the commentary and a results dashboard is a few distinct data layers. Each one has a different shelf life, and each one belongs in a different part of your workflow.
The calendar layer. Which companies report today, tomorrow, and over the next few weeks — usually sourced from board-meeting intimations filed with the exchanges. This is forward-looking and the most mechanically useful thing on the page.
The outcome layer. Revenue, operating profit, net profit, EPS, and YoY/QoQ growth once the filing is out. Backward-looking, and for an intraday system, mostly already priced by the time you read it.
The reaction layer. Market movers, sector performance, index closes, breadth. This is the tape's answer to the outcome layer.
The flow layer. FII and DII net activity. One recent MarketByte wrap described a session where "domestic institutions bought while foreign investors trimmed exposure, keeping the tape range-bound" — that is a flow description, not a forecast, and it is a reasonable way to use it.
The interpretation layer. The AI summaries and "here is the day in five minutes" writeups. Useful for orientation. Dangerous as a trigger.
An algo should consume layers one and four as data. It should treat layer five as reading material.
"Beat estimates" is a comparison, not a verdict
MarketByte itself makes this point in an explainer: everyone cheers when a company beats estimates, but a beat is a comparison against analyst consensus, not a judgement on the business or on what the stock will do next.
This matters enormously if you are tempted to build a rule like "go long on beats."
Three problems with it:
- Consensus is not public, standardised, or stable. Different data providers carry different estimate sets, compiled from different analyst panels, revised at different times. "Beat by 3%" from one source can be "in line" from another.
- The reaction is conditional on positioning. A beat into a stock that has already run 20% in a month behaves differently from the same beat into a beaten-down name. Your rule has no access to that context unless you build it in.
- The headline number is often the least important part of the filing. Margin direction, one-offs, order book or guidance commentary, provisioning for a lender — these frequently drive the move more than the profit line.
A headline like "13 companies reported, 8 ahead of estimates" is a genuinely useful one-line orientation. It is not an input you should size a position on.
If you want to use beat/miss data, use it as a state descriptor for your own study — "how do my setups perform in the 2 sessions after a result, split by beat and miss" — and let the backtest tell you whether it carries any information for your specific strategy. Do not assume the direction.
Turn the results calendar into a blackout layer
This is the highest-value conversion, and it is boring on purpose.
For every symbol your system can trade, you want a maintained field: next known results date, plus a confidence flag for whether that date is confirmed by an exchange filing or still tentative.
Fields worth extracting
- Symbol and ISIN (so you can join cleanly across feeds)
- Scheduled results date
- Confirmed vs tentative
- Expected timing — pre-market, during-market, or post-close
- Whether the symbol is in F&O
- Whether it is an index constituent, and roughly how much it matters to the index
- Last known results date (to catch yesterday's post-close filer)
That last field catches the most common failure. A company files at 6 PM. Your scanner wakes up at 9:15 the next morning, sees a clean gap-and-go structure, and fires. The structure is real. The reason behind it is a 15% overnight repricing your strategy was never designed for.
Three event states, three different behaviours
Rather than one blunt on/off switch, most systems benefit from graded states:
Pre-event window (T-1 and T-day). Reduce size or skip entirely for mean-reversion and short-premium logic. The distribution of the next move is wider than your average day, and your stop was calibrated on average days.
Event-day post-filing. Spreads widen, depth thins, and the first few minutes are frequently unrepresentative. A simple time filter — no fresh entries in the first 15 minutes after a filing, or on the stock at all on event day — removes a lot of avoidable slippage.
Post-event normalisation (T+1 to T+2). The gap is in the chart now, which means your indicators are contaminated. An ATR-based stop calculated across an earnings gap can be two to three times its usual width, which silently changes your position size if you size off ATR. Decide explicitly whether to exclude the gap bar, widen the stop, or stand aside.
You can encode all of this as plain conditions in a no-code strategy builder or as a filter stage ahead of your stock scanner output. The point is that it lives in the system, not in your head at 9:14 AM.
Index-level context during reporting season
Earnings season changes the composition of index moves, not just their size.
A Nifty move during a quiet week is usually broad. A Nifty move during reporting season is often two or three heavyweights doing all the work while everything else sits still. The MarketByte wraps capture exactly this texture — "IT did the heavy lifting; private banks dragged" on one session, "metals and energy did the work while defensives took a breather" on another.
For an algo, that distinction is actionable in a specific way: index direction and participation can disagree, and your filters need to know which one they are reading.
If your strategy uses a Nifty or Bank Nifty trend filter to gate stock entries, a heavyweight-driven index move will pass that filter while the median stock in your universe is going nowhere. Your entries get taken in a tape that will not support them.
Two cheap additions help:
- A breadth check alongside the index check. Advance-decline, or the share of your scan universe above its own short-term average. If the index is up and breadth is flat, treat it as a lower-conviction regime.
- A sector check for the specific symbol. Anadi's Indices view exists for this reason — index cards plus a sector heatmap as context before acting on a scanner or option setup, rather than as a forecast. During earnings season the sector lens is unusually informative, because results cluster by sector and the whole sector reprices together.
This is also why a structured weekly market outlook is more useful than a daily one during reporting season: the calendar of who reports when is a weekly-horizon fact, while the reaction is noise at the daily level.
Expect your data sources to disagree
Pull index levels from three different public pages during earnings season and you will get three different numbers. Snapshot timing differs, some pages cache, some show previous close, some show a delayed feed, and dashboards update on their own schedules.
For a human skimming for orientation, this is harmless. For an automated system, it is a correctness bug waiting to happen.
The rule to adopt: one feed is authoritative for execution, everything else is reference. Your authoritative feed should be the one your broker API actually fills against. If a public dashboard says the index is at one level and your broker feed says another, your orders are being priced off the broker feed — so that is the number your risk logic must use.
Keep the reference feeds for what they are good at: calendars, filing links, flow data, sector context. Do not let a reference feed set a stop.
What reporting season does to options workflows
Single-stock options around results are a different instrument from the same options two weeks later.
Implied volatility typically builds into a known event date and resets quickly after the filing. If you are short premium into a result, you can be directionally right and still lose, or directionally wrong and still make money on the IV collapse. Neither outcome tells you your strategy works.
Practical checks before an earnings-period options entry:
- Is a result scheduled inside the life of this position? Including — especially — the far leg of a calendar structure.
- How much of the current IV is event premium? Compare the front expiry against the next one. A large gap is the event being priced.
- Is the strike liquid enough to exit in a hurry? Single-stock option books thin out fast away from the money. Check the bid-ask you would actually pay, not the mid.
- Does your margin estimate account for existing positions? Anadi's Easy Trade workflow puts basket preview, margin estimate with positions considered, and the risk budget in front of execution precisely so this check happens before the order, not after a shortfall message.
- What is your defined worst case? For index structures too. Basket-level risk limits and a hard daily loss limit matter more in a wide-distribution week than in a calm one.
For stock F&O candidates specifically, Anadi's Action Center is designed as the filter between raw scanner noise and execution — it carries blocked reasons such as chase distance and invalidated price, plus F&O eligibility, OI pulse and VWAP context. Earnings season is when that kind of gating earns its keep, because the raw signal count goes up while the quality of the average signal goes down.
One exchange-level item to verify yourself rather than assume: F&O ban periods, position limits and any symbol-specific restrictions change, and a stock can enter a ban window mid-season. Check the current list on the exchange site before you rely on a symbol being tradeable.
Backtesting through an earnings season
If your backtest does not know about results dates, it is quietly optimistic. Three specific distortions:
Gap fills. A strategy that enters at the open after an event is modelled as filling at the open print. In reality, the pre-open session during a results reaction is volatile and your fill is uncertain. Add explicit slippage for post-event bars rather than using your normal average.
Survivorship in the signal. Many trend and breakout systems look wonderful in backtest partly because they catch post-earnings drift in the names that gapped up. If that is where the edge lives, you want to know it, because it means the strategy is really an earnings-reaction strategy and should be risk-managed as one.
Stop placement across gaps. A stop below yesterday's low is meaningless when price opens 12% away from it. Model gap-through-stop exits honestly, at the open, not at the stop level.
The constructive version of all this: run your options backtesting or stock backtest twice — once over the full history, once with event windows excluded — and compare. If the edge survives both, it is probably structural. If it only exists in the event windows, you have learned something important about what you are actually trading.
If you want to build these event filters into a strategy and test them against history before putting capital behind them, you can request early access and set them up in the builder directly.
Earnings season checklist
Run this once a week during reporting season, not once per trade:
- Calendar refreshed. Next results date and confirmed/tentative flag updated for every symbol in your universe.
- Yesterday's post-close filers tagged. These are tomorrow's false scanner signals.
- Blackout rules active. Pre-event, event-day and T+1/T+2 behaviour defined per strategy, not improvised.
- ATR and stop logic gap-aware. Know whether an event gap bar inflates your stop width and therefore shrinks your size.
- Breadth check sitting next to your index filter. So a heavyweight-driven index move does not masquerade as a broad trend.
- One authoritative price feed. The one your broker fills against. Everything else is reference.
- Options legs checked against the calendar. Including far legs and any result scheduled inside the position's life.
- Margin estimated with existing positions included, before the order goes in.
- Daily loss limit set and enforced by the system, not by willpower.
- Beat/miss treated as a study variable, never as a standalone trigger.
Earnings season does not require a new strategy. It requires the strategy you already trust to know what day it is.