The headlines from this past week were easy to summarise: BSE Sensex ended over 380 points down in one session, NSE Nifty50 closed below 24,480, and almost every market report pointed at the same culprit — crude oil. Brent pushed back toward the $89–90 zone as uncertainty around the Strait of Hormuz kept energy markets on edge, and Indian indices spent the week drifting rather than trending.
If you run algos, this is exactly the kind of week worth reviewing on a Sunday. Not to predict Monday — nobody can — but to check whether your systems behaved the way you designed them to, and to set your risk posture before the next open instead of during it.
This post walks through what the week actually looked like, why a single red close deserves less weight than most traders give it, and a weekend review workflow you can repeat every time the market gets pinned by one macro variable.
What the week actually looked like
Strip the drama out of the headlines and the facts were roughly this:
- The Sensex ended one session over 380 points lower, with the Nifty closing below 24,480. Intraday, the fall was deeper — at one point the Sensex was down around 430 points near 78,100.
- Brent crude climbed about 1.5% to around $89 a barrel early in the week after a 5% surge the previous Monday, and later traded above $90. Over the past month, Brent has swung between roughly $72 and $102 as hopes rose and fell around a US–Iran resolution that would reopen tanker flows through the Strait of Hormuz.
- Gift Nifty pointed to flat-to-weak opens through the week — around 24,542 on Wednesday — and the cash market largely delivered exactly that: muted opens, shallow drifts, no follow-through.
- India's CPI inflation came in at 4.45% year-on-year, up slightly from 4.38% in June — above the RBI's comfort threshold for a second month, driven mostly by food prices. Brokerage commentary suggested this alone may not force a policy response, but it adds one more variable to the tape.
- US CPI was the global event of the week, with softer inflation offering some relief to Asian markets — relief that Indian indices mostly failed to convert into gains because crude stayed firm.
- Under the surface, the tape was mixed rather than uniformly weak. On the same red morning, Bharti Airtel, M&M, UltraTech, Adani Ports, Titan and Bajaj Finance lagged while SBI, Tech Mahindra, Axis Bank and Asian Paints gained.
One analyst line from the week captured the structure better than any index number: the market is "defying a breakout on the upside and is moving sideways," with firm Brent as the principal factor restraining a rally.
That's the regime. Sideways, headline-pinned, with sector rotation underneath. Now the question that actually matters: what does your algo workflow do with that?
A 380-point fall is data, not a signal
The first instinct after a big red close is to do something — tighten stops everywhere, switch off systems, or worse, add a discretionary short because "the trend has turned."
Resist all three until you've classified the day.
A 380-point Sensex fall is about 0.5%. In a genuinely volatile regime, that's an ordinary day. What makes a red close meaningful for an algo trader isn't the point count — it's the context:
- Was it a breakdown or a drift? A drift-down day that opens near its high and bleeds slowly (like the session that made the headlines — the open was effectively the intraday high) behaves very differently from a gap-down with expanding range. Trend systems, mean-reversion systems, and option sellers experience these two days in opposite ways.
- Was breadth confirming? When SBI, Axis and Tech Mahindra are green on a red index day, the fall is concentrated, not systemic. A scanner running long setups will still find candidates — the question is whether your process lets you take them.
- Was the driver priced or new? Crude above $89 was not new information by mid-week. Markets had already swung through a $30 Brent range over the month. A red close on a known driver is repricing, not regime change.
None of this tells you what happens next. It tells you what bucket the day belongs in — and your systems should respond to buckets, not headlines.
The crude–rupee–cues chain, and what an algo can honestly encode
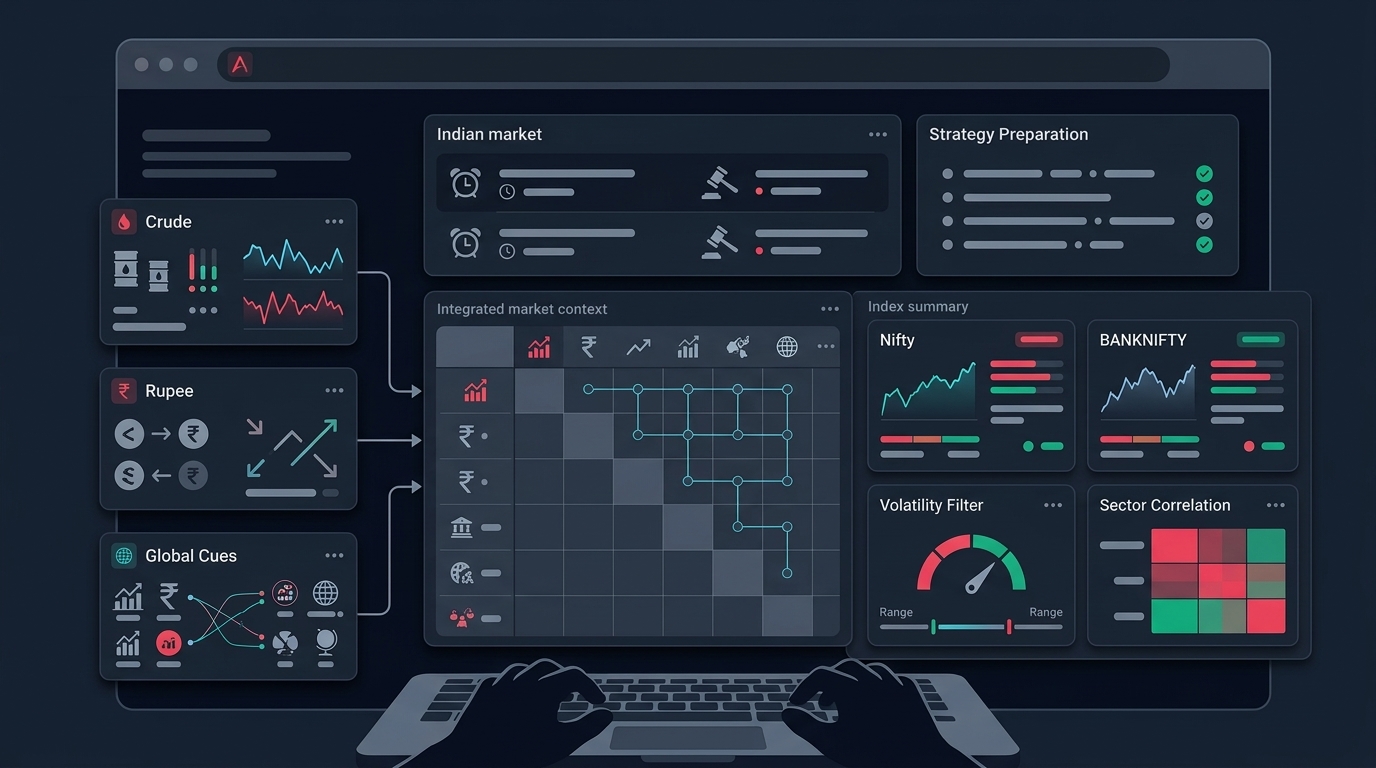
The transmission everyone cites goes: Hormuz risk pushes crude up, expensive crude pressures the rupee and stokes inflation worries in an oil-importing economy, and risk appetite for Indian equities fades. All of that is real. The mistake is trying to turn the narrative directly into entry signals.
Here's the honest split:
What you cannot encode: whether the strait reopens this week, whether Brent goes to $80 or $100, whether FIIs sell tomorrow. Any rule built on predicting these is a guess wearing an if-statement.
What you can encode: your own exposure response to observable states. For example:
- A crude-band filter: when Brent has moved more than a defined percentage over the past N sessions, cap overnight exposure or reduce position size on new entries. You're not predicting oil; you're acknowledging that gap risk is elevated.
- An index-alignment gate: no fresh longs from your stock scanner when the Nifty is below a defined structure level and sector breadth is negative. This is exactly why scanner entries need index context — a strong single-stock setup in a weak tape has a different expectancy than the same setup in a supportive one.
- An event-window rule: no new positions in the 30 minutes around scheduled releases like US CPI or domestic inflation prints. The week just showed why — direction around these events flipped between the futures indication and the cash close.
Notice that every rule above changes your behaviour, not your forecast. That's the entire trick with global cues: feed them into risk state, never into direction. Your risk management layer is where crude belongs — not your entry logic.
The weekend review: four steps before Monday
A week like this one is the best possible input for a Sunday review. Here's a structure that takes under an hour.
Step 1: Classify the regime in writing
One or two sentences, written down, before you look at any setup. For this week it might read: "Sideways index pinned by crude above $89, failed breakout, mixed breadth, domestic CPI above threshold, sector rotation active."
Writing it down matters because it forces you to defend next week's trades against it. If your system fires a breakout long on Monday and your own regime note says "failed breakout, headline-pinned," you have a documented conflict to resolve — before money is at risk, not after.
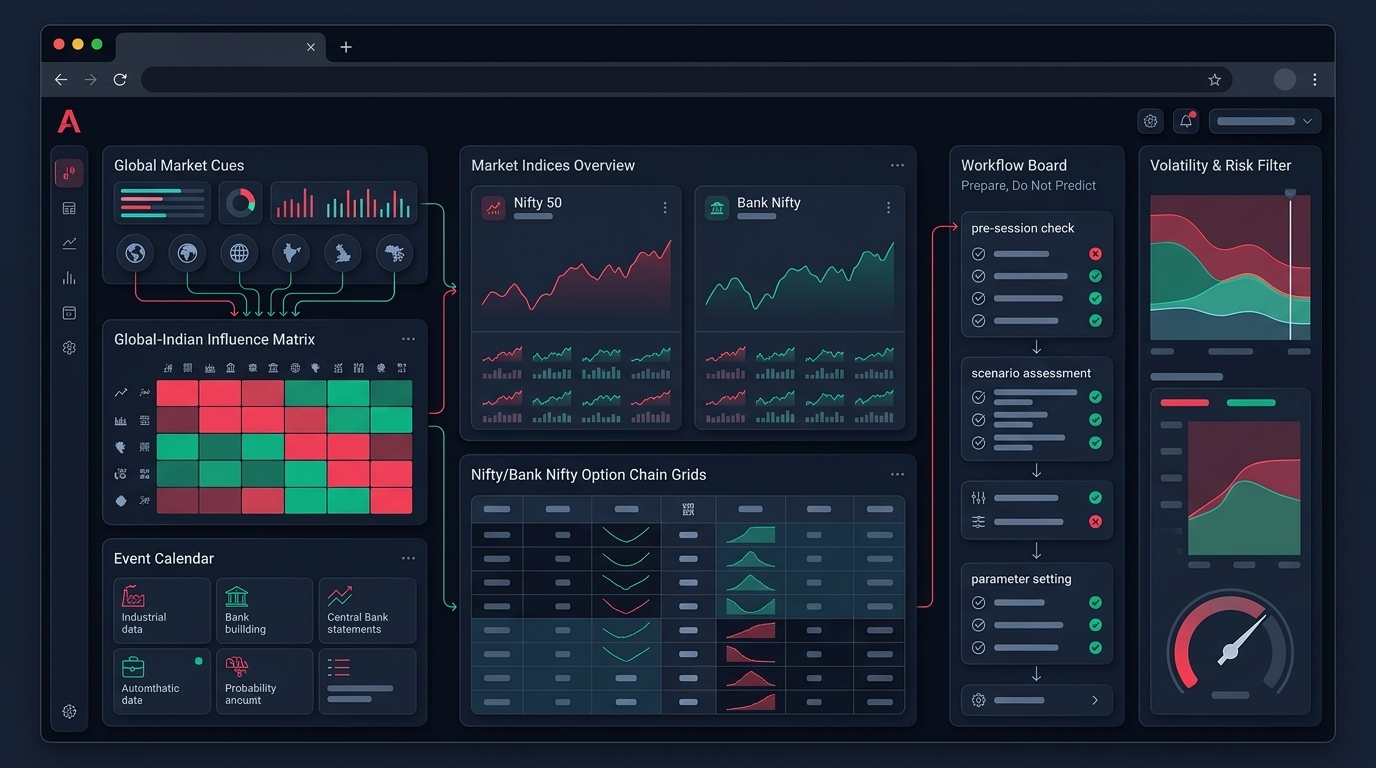
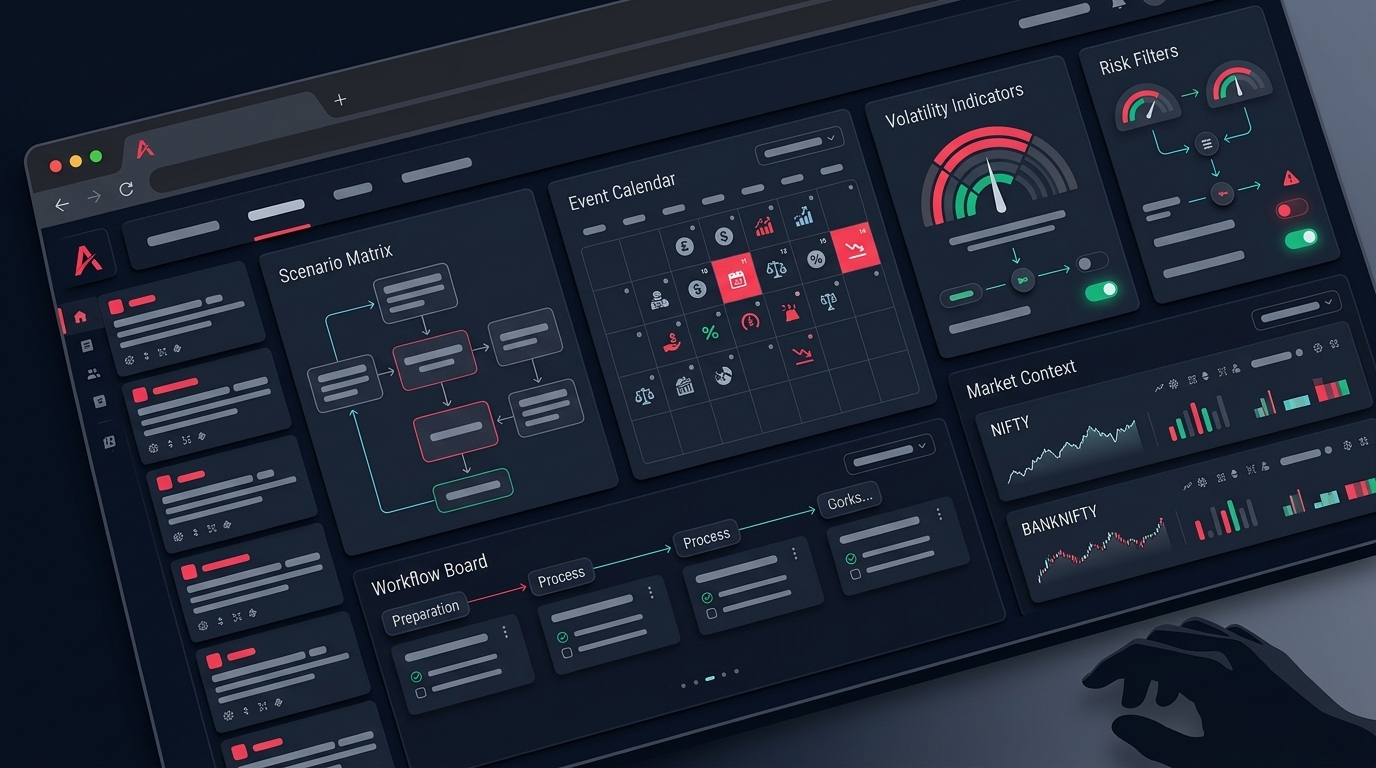
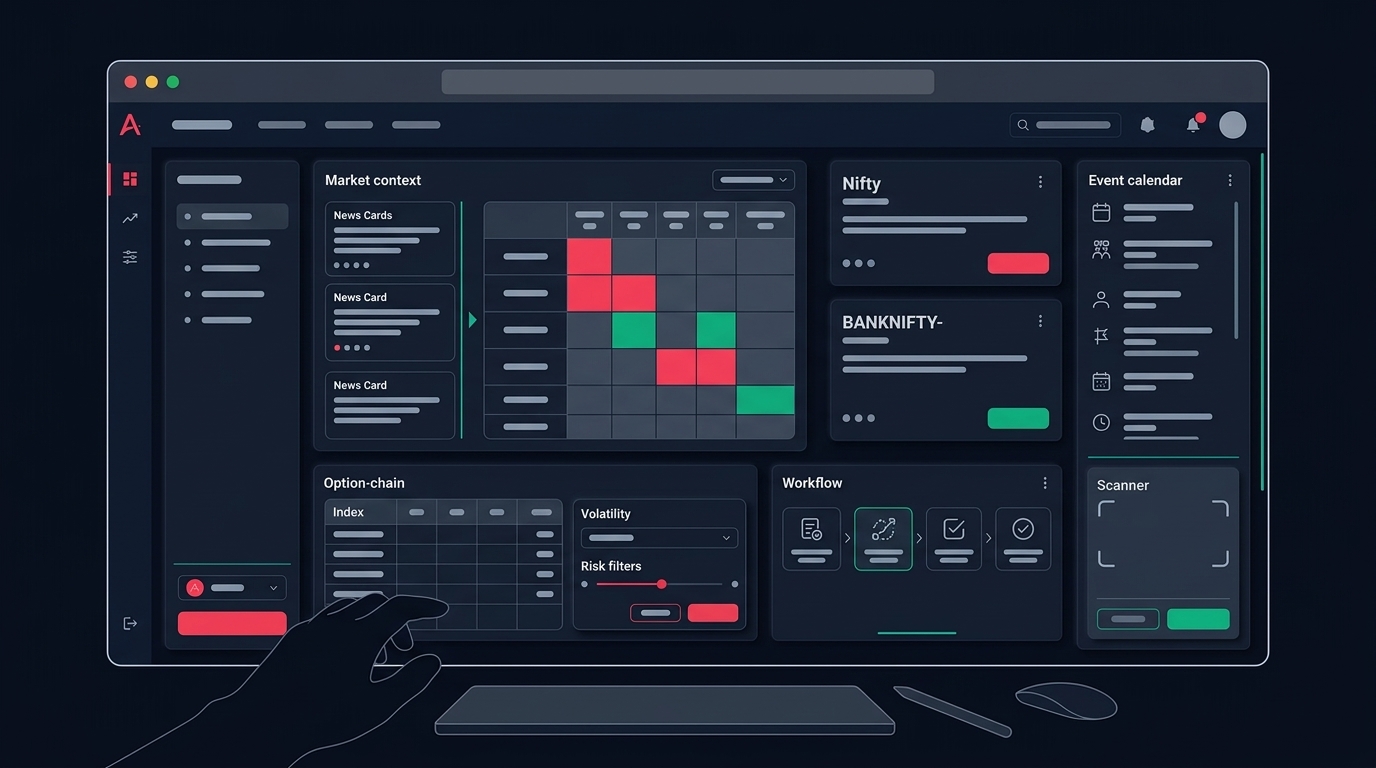
Anadi's index cards and sector heatmap exist for exactly this framing step: index and sector context first, individual setups second. The weekly market outlook is built on the same principle — use context to prepare, not to chase.
Step 2: Audit last week's execution, not just P&L
P&L on a choppy week is mostly noise. Execution quality isn't. Pull up last week's orders and check:
- Slippage on entries and exits. Sideways weeks with headline spikes often produce worse fills than trending weeks because liquidity thins around news. If your live slippage ran meaningfully above your backtest assumption, your edge estimate is wrong, and it's wrong every week — you just noticed it now.
- Manual overrides. Did you skip a signal because "crude was scary," or exit early on a headline? Count them. Overrides are either a missing rule (encode it) or discipline leakage (stop it). Both need to be named.
- Signal-to-action gap. How many scanner signals did you actually evaluate versus let scroll past? A ranked queue with explicit blocked reasons — price already chased, setup invalidated — is how Anadi's Action Center handles this, and it's a good model even if you do it manually: every skipped signal should have a stated reason, not a vibe.
Step 3: Set next week's risk state explicitly
Decide, on Sunday, what your exposure rules are for the week — so Monday's open doesn't decide them for you. In a crude-pinned regime, the practical dials are:
- Position size multiplier (full, three-quarters, half) for new entries.
- Overnight exposure cap, given that Brent has shown it can move 5% in a session on Hormuz news that breaks outside Indian market hours.
- A daily loss limit you will actually honour, sized so that a gap against you doesn't force emotional decisions.
- For option positions: check what firm crude and event risk imply for your short-vega exposure. A basket that looks fine on Greeks in a quiet tape can be uncomfortably concentrated when one macro variable dominates. Reviewing margin and payoff at the basket level — before entry, not after — is the whole point of treating options as a workflow rather than strike-picking.
Step 4: Map the event calendar and pre-commit avoidance windows
List the week's scheduled events: domestic data releases, US inflation and rate-expectation prints, expiry days, and any policy announcements. For each, decide in advance: trade through it, reduce around it, or sit out. The specific choice matters less than the fact that it's pre-committed. The trader who decides during the event decides worst.
What this means for scanner and backtest workflows
Two quieter lessons from the week deserve their own note.
First, sideways weeks are where scanners earn or lose their keep. A trending week makes every momentum scanner look smart. A week like this one — index flat-to-down, individual names rotating — is where filter quality shows. If your scanner surfaced dozens of signals that went nowhere, the fix is usually not a new indicator; it's an index-alignment or freshness filter that suppresses signals fighting the tape. Review which of last week's signals were taken, which were blocked, and whether the blocks were right.
Second, your backtest probably hasn't seen this exact regime mix. A month where Brent travels from $72 to $102 and back, with a geopolitical chokepoint driving overnight gaps, is a fat-tail environment. If your strategy's backtesting window is dominated by calm years, its drawdown estimate under this regime is optimistic. That's not a reason to switch systems off — it's a reason to run them at reduced size, or to route new strategy ideas through paper trading first and compare live behaviour against backtest expectations before committing capital.
If you want the whole loop — index context, ranked scanner queue with blocked reasons, option chain and basket margin checks, and paper-first execution — in one place instead of six tabs, that's what we're building at Anadi Algo. You can request early access here.
The Sunday checklist
Before Monday's open, after any headline-heavy week:
- Write the regime in one line. Sideways/trending, what's pinning it, breadth state.
- Bucket the red days. Drift or breakdown? Known driver or new information?
- Audit execution. Slippage versus backtest assumption, overrides counted and explained, skipped signals with reasons.
- Set the dials. Position size multiplier, overnight cap, daily loss limit — decided now, not at 9:20 am.
- Pre-commit event windows. US and domestic data, expiry days: trade, reduce, or avoid — chosen in advance.
- Check option baskets at the portfolio level. Margin, payoff, and vega concentration reviewed before the week starts.
- Log one process improvement. One rule to add, one override to eliminate. Ek hafte mein ek sudhaar is enough — it compounds.
A 380-point fall will happen again. Crude will spike again. The traders who survive these weeks aren't the ones who predicted them — they're the ones whose Sunday process made Monday boring.