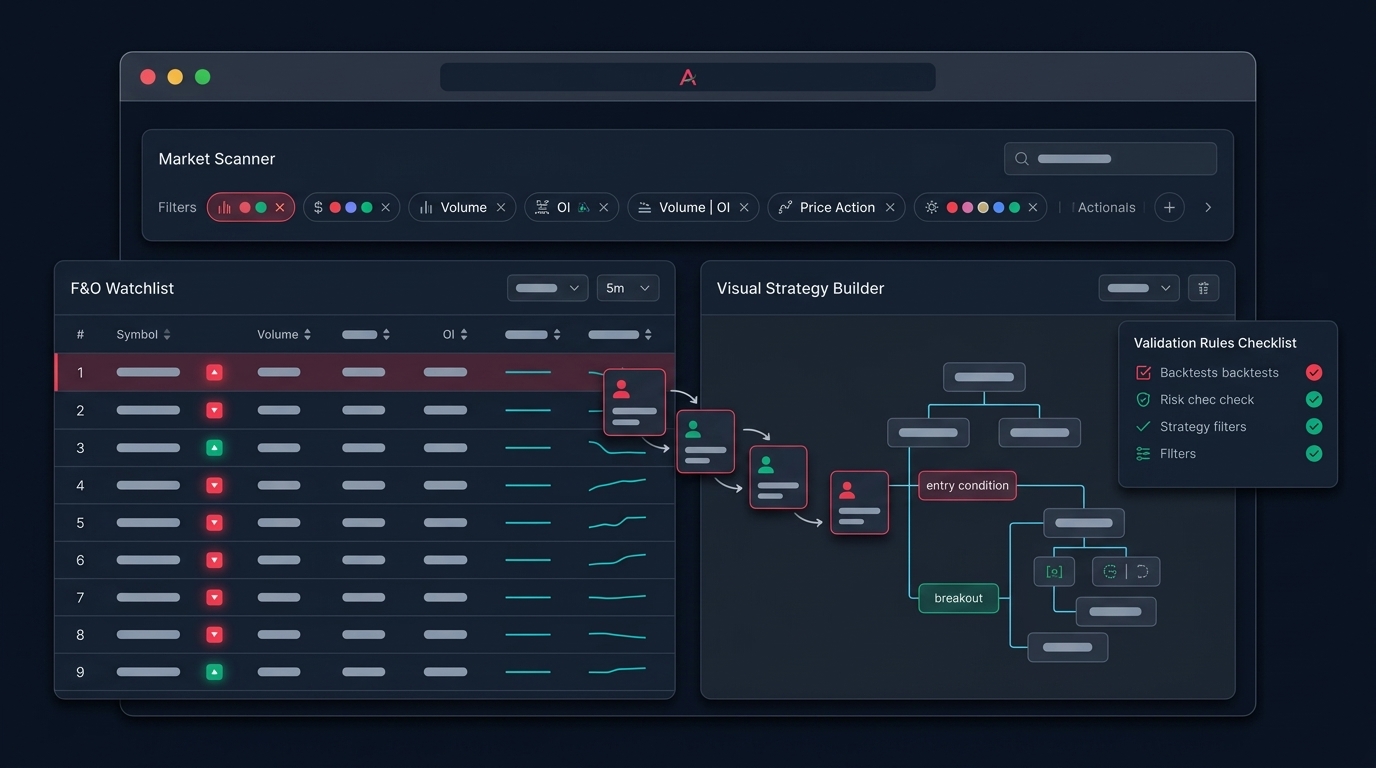
A breakout scanner is easy to build and hard to trust. Point one at the F&O universe and it will happily return 40 "breakouts" before 10 a.m. — most of which fade, chop, or reverse straight into your stop. The problem is rarely the scanner. It is the lack of filters between a raw signal and a tradable setup.
This post walks through the filters that actually reduce noise on an F&O breakout scan: liquidity, volume, trend structure, open interest, and false-breakout checks. The goal is fewer, cleaner candidates — not more alerts.
Why raw breakout signals are mostly noise
A naive breakout condition (price crosses above the previous day high, or the opening range high) fires on every symbol that ticks one paisa past a level. It cannot tell the difference between a liquid index heavyweight breaking out on heavy volume and a thin stock spiking on a single large order.
In the F&O segment this matters more, because you are not just buying the cash stock — you may route the trade through futures or options where spreads, slippage, and OI behaviour decide whether the edge survives. A signal that looks clean on a 5-minute chart can be untradable once you add execution cost.
So treat the scanner output as a starting list, not a watchlist. Filters are what convert it.
Filter 1: Liquidity first
Liquidity is the filter that should run before everything else, because it removes symbols you should not trade regardless of how pretty the breakout looks.
Practical liquidity checks for F&O breakouts:
- Stay inside the F&O list. Only NSE F&O stocks have futures and options to route through. A breakout in a non-F&O microcap is a different (and riskier) game.
- Check option-side liquidity, not just cash volume. A stock can be active in cash but have wide option spreads on the strike you want. If the bid-ask on the at-the-money option is wide, your real entry price is worse than the screen.
- Prefer instruments where futures basis is sane. A futures price far from fair value (deep premium or discount) is a sign of stretched positioning or low liquidity.
If you are running this on Anadi, the cash-stock signal can be re-used with an F&O filter so the same scanner logic carries into futures and option context (score, eligibility, OI, basis, PCR) instead of you eyeballing each chain manually.
Filter 2: Volume confirmation, measured the right way
"High volume" is meaningless in absolute terms — Reliance always trades more than a mid-cap. What you want is relative volume: volume now versus the same time-of-day average over the last 10–20 sessions.
Useful volume filters:
- Relative volume above roughly 1.5x to 2x at the moment of breakout. A breakout on below-average volume is the classic trap.
- First-hour volume strength for opening-range breakouts. The original ORB method gained reliability once traders added first-hour relative volume as a confirmation, instead of trading every 15-minute poke.
- Volume on the breakout candle specifically, not just cumulative day volume. A surge on the candle that clears the level is what signals real participation.
Keep the absolute thresholds conservative. A single oversized print can inflate volume for one candle, so look for sustained participation across two or three candles rather than one spike.
Filter 3: Trend and structure alignment
A breakout against the larger trend is a lower-quality signal. Adding a simple structure filter removes a lot of intraday chop.
- Position relative to VWAP. Long breakouts holding above VWAP, short breakouts below it, filter out a lot of fakeouts.
- Higher-timeframe agreement. If your scan runs on 5-minute candles, check that the 15-minute or daily structure is not pointing the other way.
- Distance from the level. If price has already run far past the breakout level by the time the signal prints, you are chasing. A "chase distance" check protects you from late entries that leave no room for a sensible stop.
This is also where you decide whether the trade is even worth taking: if the nearest logical stop is far away, the position size that respects your risk management rules may be too small to bother with.
Filter 4: Open interest as confirmation, not prediction
Open interest is widely misread. Rising OI with rising price is often described as long buildup, and rising OI with falling price as short buildup — but OI is context, not a guarantee. Data can be stale, and buildup labels can flip within the session.
Use OI as a confirming layer on top of a price breakout, never as the trigger by itself:
- Does OI support the direction? A bullish cash breakout backed by long buildup in the future is more coherent than one fighting fresh shorts.
- Check PCR and OI pulse for context, not as a standalone signal.
- Treat freshness seriously. Confirm the OI reading is current before you lean on it.
The honest framing: price action leads, OI confirms. If the two disagree, that disagreement is itself a reason to size down or skip.
Filter 5: False-breakout filters
This is the filter set that separates disciplined traders from alert-chasers.
- Close beyond the level, not just a wick. Wait for the candle to close past the breakout level rather than acting on an intrabar touch.
- Retest behaviour. Many of the cleanest entries come after price breaks out, pulls back to the level, and holds. A failed retest is a clean signal to stand aside.
- Time-of-day awareness. The first few minutes after open are noisy. A breakout at 9:16 and one at 11:30 are not the same quality of signal.
- Invalidated price. If price has already traded back below the level, the breakout is invalidated — the signal is stale even if the scanner still shows it.
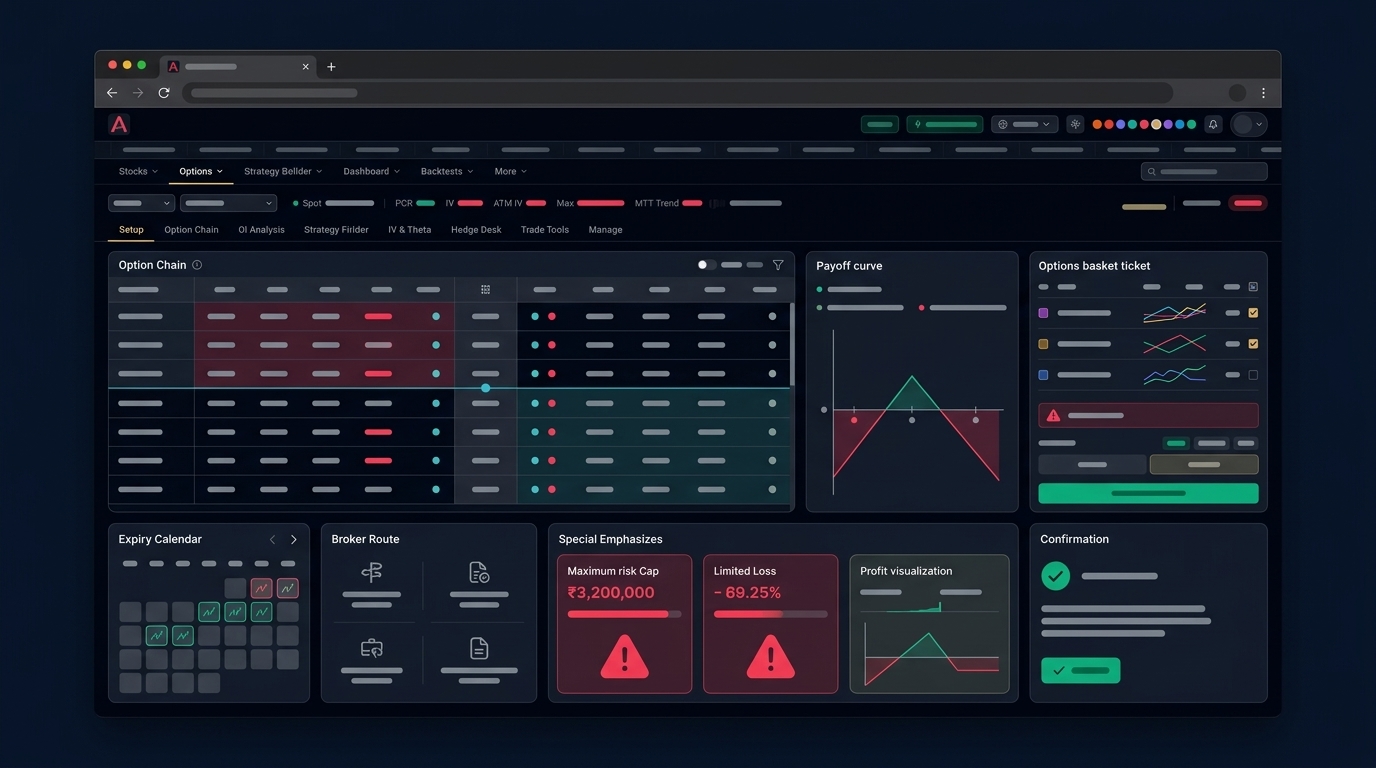
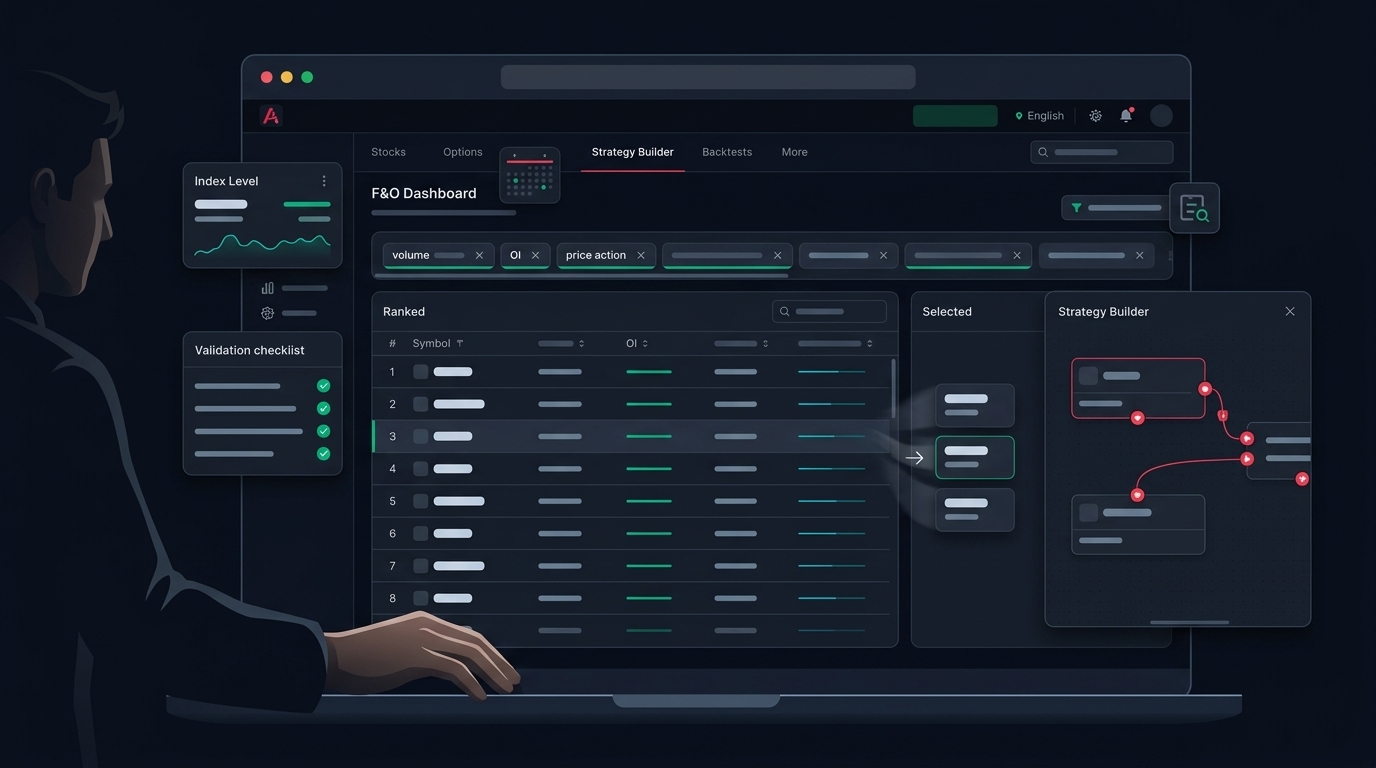
From filtered signal to a decision
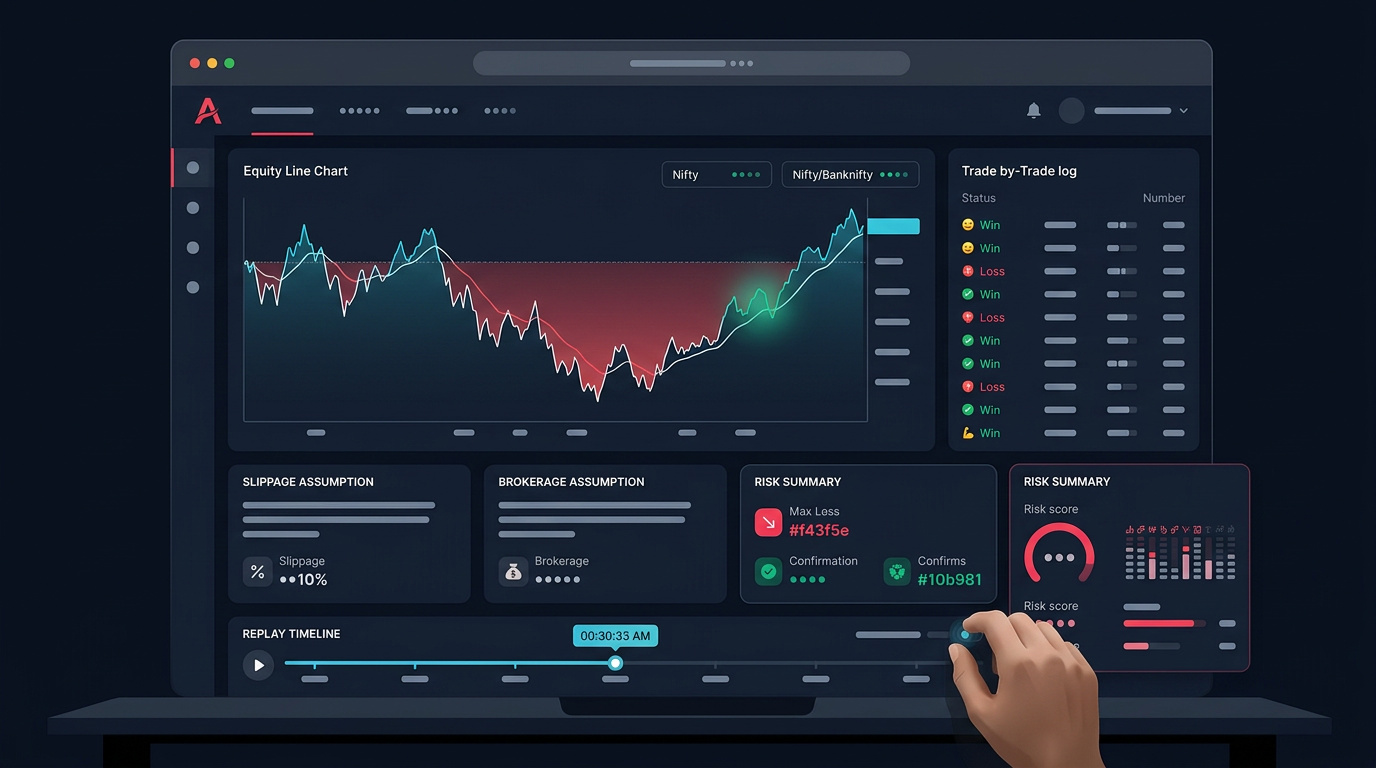
Filters should narrow a long list into a short, reviewable queue. A workable sequence looks like this: signal fires, check freshness, open the chart for structure, confirm relative volume, mark the level and stop, then read OI/basis to choose the route (stock, future, or option). Only then does it become a candidate to trade — or to send to a backtest so you can check whether the filter combination has any historical edge before risking capital.
That last step matters. A filter set that feels cleaner is not the same as one that survives a few hundred past signals. Test it.
A practical filter checklist
Before you act on any F&O breakout signal, run it through this:
- Is the symbol in the F&O list with usable option/future liquidity?
- Is relative volume meaningfully above its time-of-day average?
- Is the breakout aligned with VWAP and the higher timeframe?
- Has the candle closed beyond the level (not just wicked)?
- Is the entry close enough to the level to allow a sane stop?
- Does OI/PCR context support the direction, treated as confirmation only?
- Is the signal still fresh and not already invalidated?
If a signal fails two or more of these, it is usually noise. Cleaner inputs mean fewer trades and fewer surprises — which is the entire point of scanning in the first place.
Want to turn scanner conditions into validated watchlists instead of raw alerts? Get early access and build the filter workflow once, then let it run.