Most retail traders open a live India VIX page, see a number, and stop there. VIX at 11 means "calm." VIX at 21 means "scary." That is where the analysis ends.
For an algo trader, that is the least useful way to use the number. A volatility index is not a signal. It is a state variable — an input your rules read before they decide position size, stop width, strike distance, and whether the strategy trades at all today.
This post is a process piece for the current market context as of September 27, 2026. No targets, no calls. Just how to turn volatility context into rules your system can actually execute.
What India VIX Actually Measures (And What It Doesn't)
India VIX is derived from Nifty options order book prices — specifically the near and next-month out-of-the-money option bids and asks. It expresses the market's implied expectation of Nifty volatility over the next 30 days, annualised, in percentage terms.
Three things follow from that definition, and each one has a direct consequence for your code.
It is Nifty-derived, not Bank Nifty-derived. There is no separate official "Bank Nifty VIX" in the India VIX family. Bank Nifty has historically moved with a wider intraday range than Nifty, and current context reflects that — recent sessions have shown Bank Nifty dropping around 1,100 points while Nifty fell roughly 383 points. If your Bank Nifty strategy reads India VIX as its volatility gate, you are using a Nifty proxy for a faster instrument. That is acceptable only if you calibrate the threshold for it.
It is annualised. A VIX of 14 does not mean Nifty will move 14% next month. Divide by roughly √252 for a daily expectation: 14 / 15.87 ≈ 0.88% per day, one standard deviation. That single conversion is what makes VIX usable in a stop-loss formula instead of a mood ring.
It is forward-looking implied, not realised. VIX tells you what options are priced for. Realised volatility tells you what actually happened. The gap between them is the single most important number for anyone selling premium, and almost nobody logs it.
The Metric Retail Traders Skip
Compute realised volatility over a trailing 10 or 20 sessions on Nifty closes, annualise it the same way, and store the ratio:
vol_ratio = India_VIX / realised_vol_20d
When that ratio sits meaningfully above 1, options are pricing more movement than the index has been delivering. When it sits below 1, the tape has been moving more than options are charging for. Neither state predicts direction. Both change which structure makes sense — and that is a decision your algo can make mechanically.
Log this daily. Six months of it is worth more than any amount of live-page staring.
Reading the Current Tape as Regime, Not Forecast
Market context as of late September 2026 shows a few things worth translating into rules rather than opinions.
Nifty has been holding around the 23,000 area after a sharp down session, with derivatives data showing heavy Call open interest clustered in the 23,600–24,000 band and notable Put open interest around 23,000–23,100. Bank Nifty has been structurally more cautious, with support referenced near 55,000–55,500 and resistance capped nearer 57,000. Global trade and tariff uncertainty remains an active background variable.
Here is the discipline point: none of that is a forecast, and you should not treat it as one.
What it is useful for is regime classification. Wide OI concentration at specific strikes tells you where liquidity and dealer positioning sit. A high-low band that is holding tells you the index is in a range state rather than a trending state. Elevated global-event risk tells you gap probability is not at baseline.
Your algo does not need to know where Nifty is going. It needs to know: is today a day my strategy was designed for?
A Three-State Regime Classifier
Keep it simple enough that you can audit it:
- Compressed — VIX in the lower part of its trailing 60-day range, realised vol falling, index inside a defined band. Breakout strategies will bleed here on false triggers. Range and premium strategies get their best conditions, but with the smallest cushion if the regime breaks.
- Normal — VIX mid-range, realised vol tracking it loosely. Most backtested strategies were implicitly fitted to this state, which is exactly why traders assume it is permanent.
- Expanded — VIX in the upper part of its trailing range or rising sharply day-over-day. Stops that worked in Compressed now sit inside routine noise. Slippage widens. Margin requirements move against you.
The important part is not the labels. It is that your strategy config reads the label and behaves differently. A system with one fixed stop distance and one fixed position size across all three states is not risk-managed — it is just lucky in two of them.
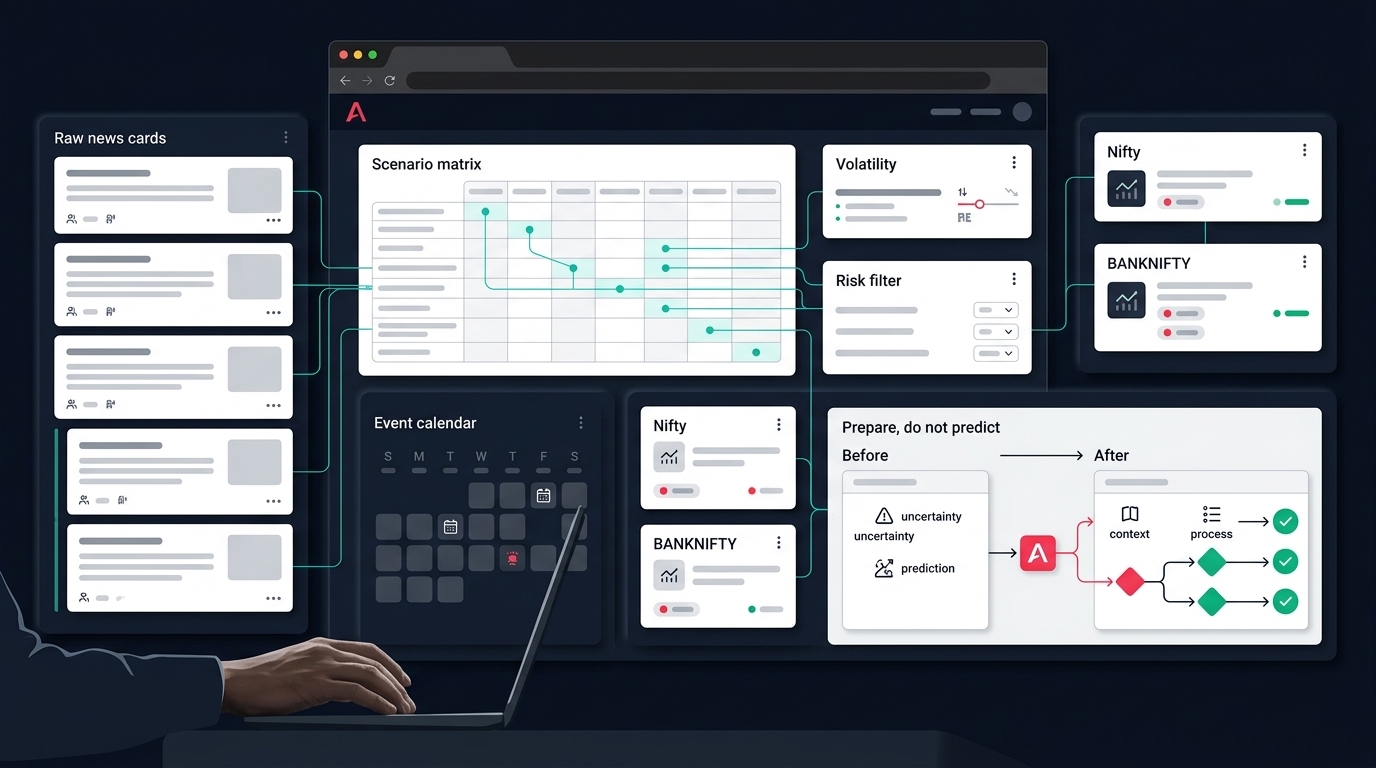
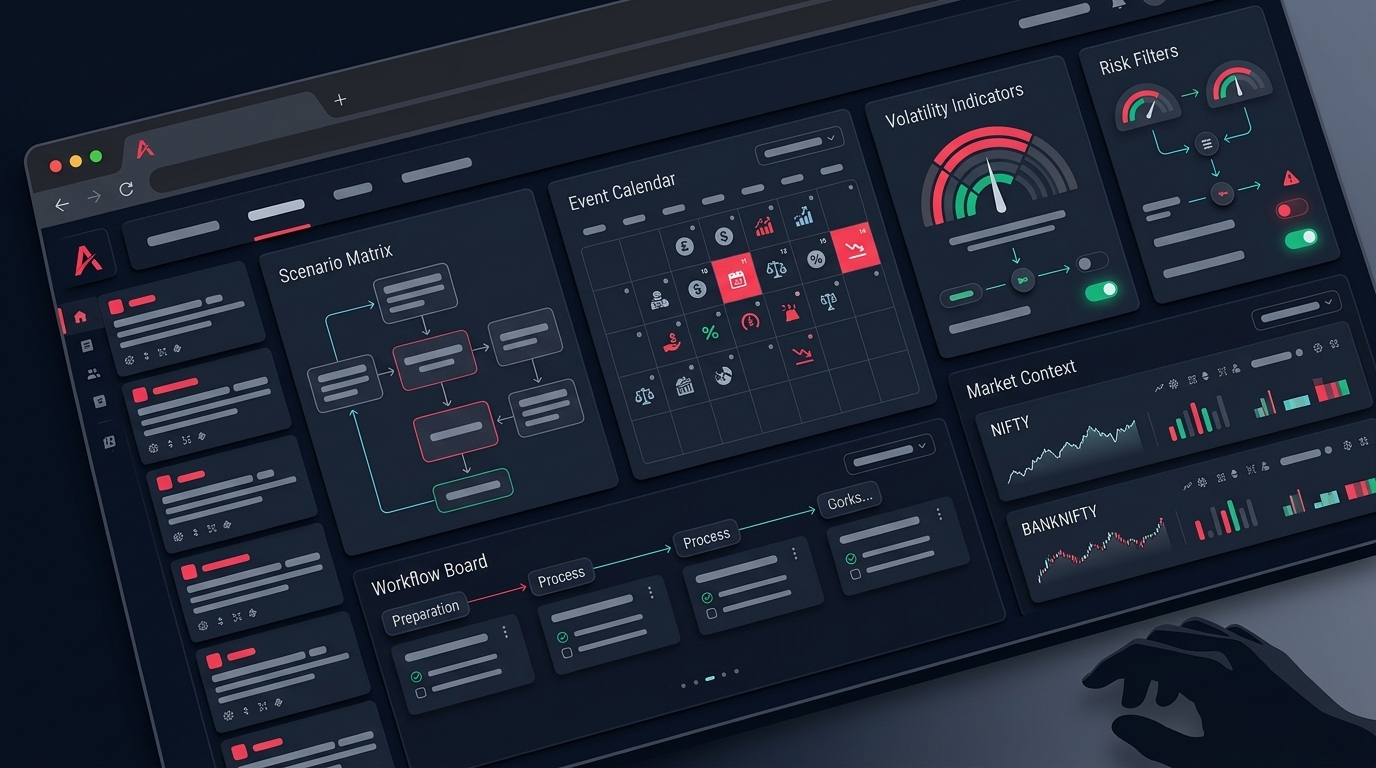
You can encode this in a no-code strategy builder as a condition layer before entry logic, so the same core strategy runs three calibrated variants instead of one blind one.
Volatility and the Options Desk: Where Direction Stops Mattering
This is where most retail options P&L quietly leaks.
You can be right on direction and still lose. If you buy a Nifty call when implied volatility is elevated and IV compresses after the event passes, the index can move your way while your premium goes nowhere or falls. Theta takes its cut regardless. Vega takes the rest.
Practical checks before any options entry:
Check IV percentile, not absolute IV. An IV of 16 means nothing in isolation. IV of 16 when the trailing one-year range is 10–30 is a different trade from IV of 16 when the range is 14–18.
Check IV against the event calendar. If there is a scheduled event — policy decision, data release, expiry, earnings for a heavyweight constituent — elevated IV before it and a collapse after it is normal behaviour, not a mispricing you discovered.
Check theta as a percentage of premium per day. For a short-dated option, theta can be a punishing fraction of the premium. If your expected move does not clear the decay over your intended holding period, the structure is wrong even if the view is right.
Check whether the structure matches the state. High IV percentile generally argues against naked long premium and toward defined-risk spreads. Low IV percentile argues the reverse, with the caveat that low-IV environments are exactly where gap risk is underpriced.
Anadi's options workspace keeps IV and theta context in the same desk as the chain, OI analysis, strategy finder, and margin estimate — so volatility state is visible while you build the structure, not after the trade is on. The hedge desk and basket preview sit in the same flow, which matters because the margin number for a hedged structure is not the margin number for a naked one.
Bank Nifty Needs Its Own Calibration
Because India VIX is Nifty-derived, Bank Nifty algos need a local volatility measure. Two cheap options:
- ATR-based — Average True Range on Bank Nifty over 14 periods, expressed as a percentage of spot. Compare today's reading to its own trailing distribution.
- ATM IV directly — pull Bank Nifty at-the-money implied volatility from the chain and track its own percentile.
Then set Bank Nifty thresholds from Bank Nifty history. Borrowing a Nifty threshold for a faster index is a calibration error that shows up as stop-outs you cannot explain. If you are building here, the BANKNIFTY strategy builder is the place to keep those thresholds explicit rather than buried in code.
Event Avoidance: The Highest-ROI Rule Most Algos Lack
Backtests almost never capture event risk properly, because a backtest sees the closing print of a gap, not the experience of holding through it.
With global trade and tariff developments in the current background, plus the standing domestic calendar, a mechanical avoidance layer earns its keep.
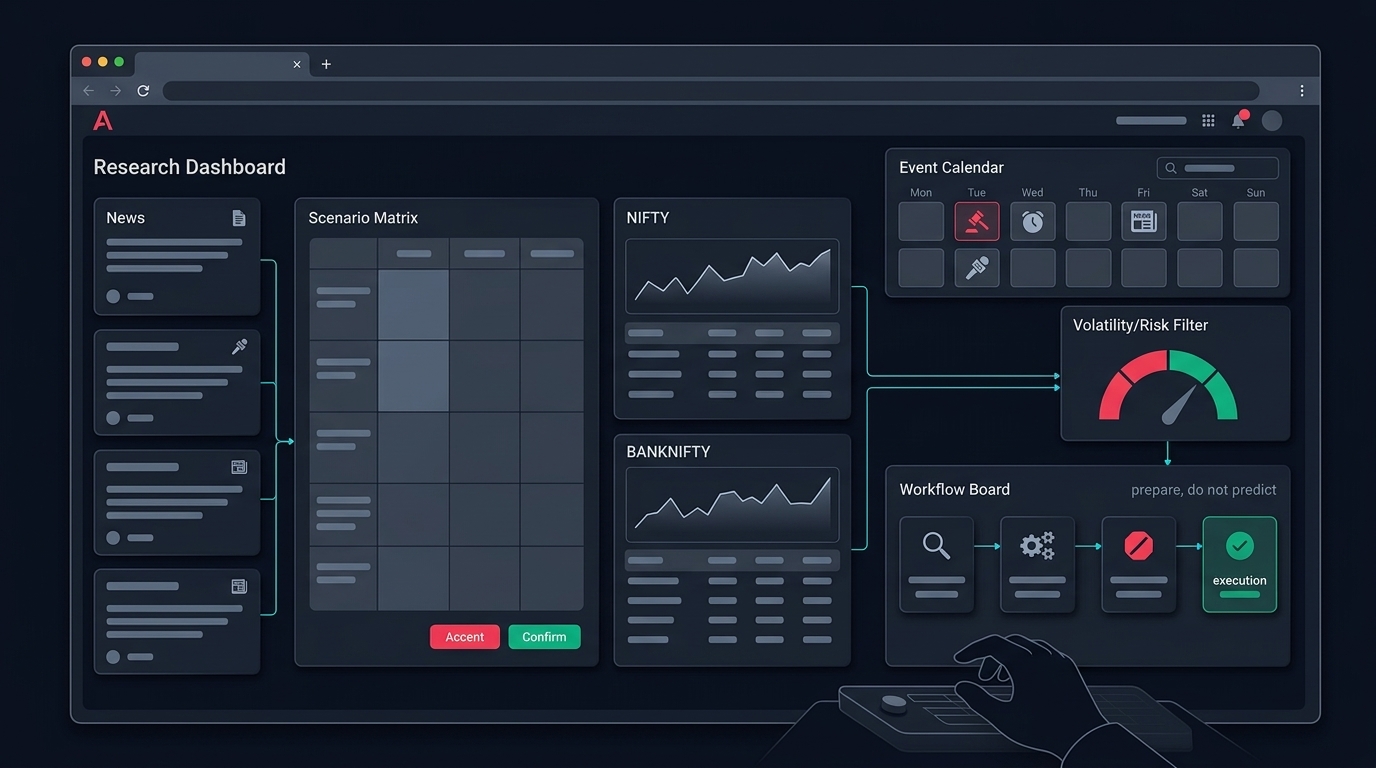
Build a simple event table your system reads at market open:
- Weekly and monthly expiry dates for Nifty and Bank Nifty
- RBI policy dates
- Domestic inflation and GDP release dates
- US Fed decision dates and major US data releases that hit Indian pre-open
- Earnings dates for heavyweight index constituents
- Known scheduled global-trade or tariff decision dates
Then define behaviour per event class. Not "be careful" — actual behaviour:
- Skip entirely for strategies whose edge is incompatible with the event
- Halve position size where you want participation with less exposure
- Widen stops proportional to expected IV expansion where the strategy needs room
- Close before the event for overnight positions in gap-sensitive structures
Write these as config, not as discipline you have to summon at 9:15 AM. Discipline fails; config does not.
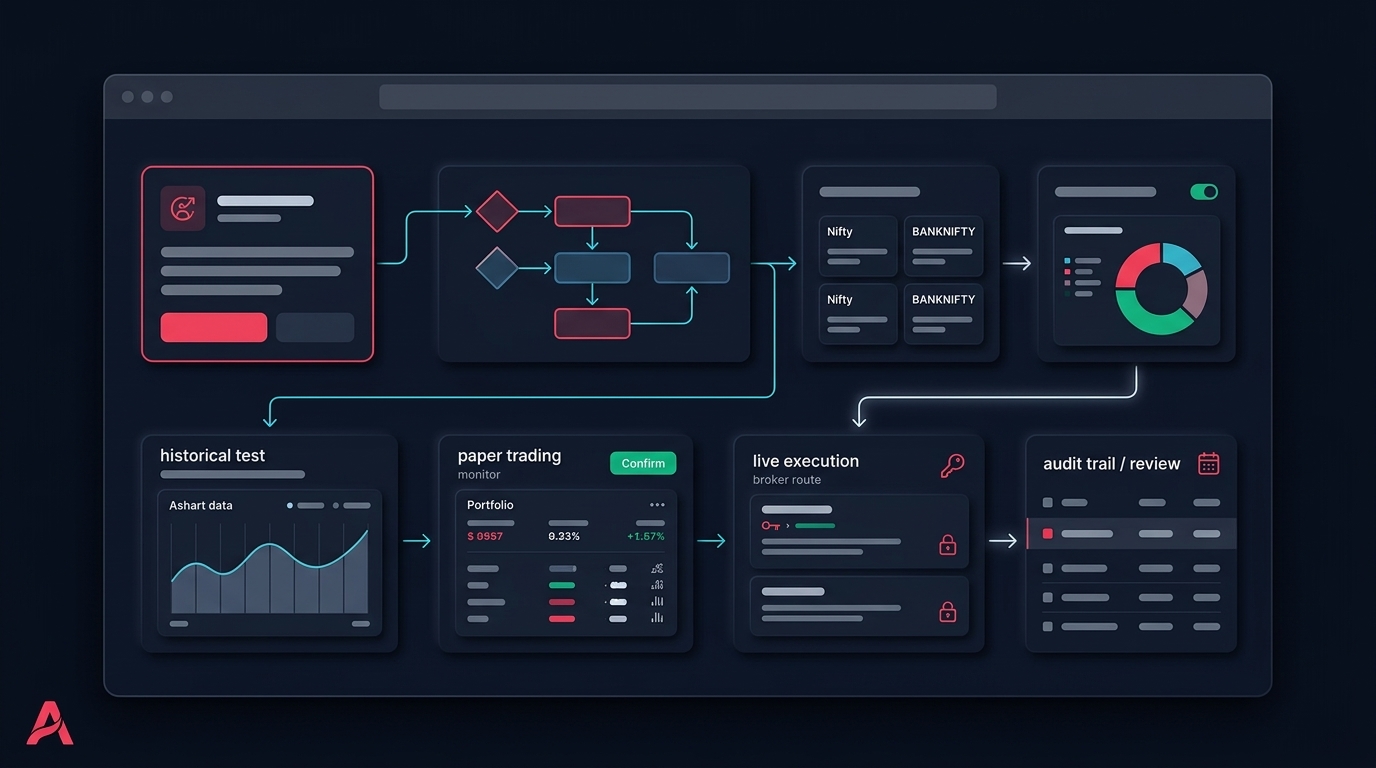
Backtest Honesty: What Volatility Regimes Expose
If your backtest shows a smooth equity curve across multiple years, the first question is not "how do I scale this?" It is "which volatility regimes are actually in this sample?"
Run these checks:
Segment results by VIX bucket. Split your backtest trades into VIX terciles and look at win rate, average win, average loss, and max drawdown per bucket. A strategy that makes all its money in one bucket is a regime bet, not a strategy.
Model slippage as a function of volatility, not a constant. A flat 0.05% slippage assumption is fiction in an Expanded regime. Option bid-ask spreads widen materially when volatility spikes, which is precisely when your stops fire.
Include gap days rather than filtering them. Gap risk in Indian markets is routinely underestimated in backtests because the gap resolves instantly in the data and slowly in reality.
Check drawdown during the worst volatility expansion in your sample. If your sample has no such episode, your maximum drawdown estimate is not an estimate.
Proper options backtesting with regime segmentation tells you something a headline CAGR never will: which market you actually have an edge in.
A Pre-Market Volatility Checklist
Ten minutes, before the open, every session:
- India VIX level and its change from yesterday — direction of change often matters more than level
- VIX position in its trailing 60-day range as a percentile, not a gut feel
- Realised vol over 20 sessions and the VIX-to-realised ratio
- Bank Nifty ATR percentage against its own trailing distribution
- Regime label — Compressed, Normal, or Expanded — logged with a timestamp
- Today's event-table hits and the exact behaviour each triggers
- Index and sector context — breadth and sector participation, because a strong single-stock setup inside a weak sector is a lower-quality trade. Anadi's index cards and sector heatmap on the indices view exist for exactly this framing step
- Strategy roster for today — which strategies are enabled, which are disabled, and why
- Position size for the regime — calculated, not remembered
- Margin headroom — with current positions considered, before any new basket
Pin the output somewhere you will see it. The value is not any single reading. It is that you have a written record you can audit against P&L six months from now.
If you want this regime and risk logic living inside your strategy config instead of your head, you can get early access and build the volatility gates directly into your rules.
Takeaway
India VIX is a thermometer, not a crystal ball. It does not tell you where the market is going. It tells you how much room to give the market before your stop is meaningless and your size is reckless.
The traders who use volatility well are boring about it. They log the number daily. They convert annualised to daily. They track implied against realised. They calibrate Bank Nifty separately. They skip scheduled events by rule. They segment backtests by regime.
None of that is exciting. All of it survives the sessions where VIX does something your backtest never saw.
This post is educational market context, not investment advice. It contains no buy or sell recommendations and makes no market predictions. Volatility conditions change without notice. Do your own research and manage your own risk.