If you opened your screen this morning and typed "Indian stock market today Nifty Bank Nifty volatility" into a search box, you are not alone. Millions of Indian retail traders start the day the same way — scanning option chains, checking GIFT Nifty, reading OI build-up tables, hunting for the one number that tells them what will happen.
Here is the uncomfortable truth: that number does not exist. What does exist is a process that turns all this data into rules you can execute the same way on a calm Tuesday and a violent expiry Thursday.
This post is about that process. No calls, no targets, no predictions. Just how to read the current market data ecosystem and convert it into filters, guardrails, and checks that survive contact with a live market.
The Data Abundance Problem
Look at what an Indian retail trader can access for free or near-free right now.
NiftyTrader offers live strike-by-strike OI, IV, change-in-OI and LTP refreshed every second across NIFTY, BANKNIFTY, FINNIFTY and 200+ F&O stocks, plus multi-leg payoff builders with Greeks and what-if spot/IV sliders backed by seven years of tick data. GoCharting streams tick-by-tick NSE data with footprint charts, volume profile, delta analysis, and pre-open IEP data from the 9:00–9:08 AM session. Downstox aggregates live index prices with news from eight-plus sources and FII/DII flow tracking. StockeZee runs live sectoral index dashboards.
Ten years ago, this level of data was institutional. Today it is a browser tab.
And yet the failure rate among retail F&O traders has not collapsed. Because the bottleneck was never data access. The bottleneck is what happens between seeing the data and placing the order.
More data without a decision framework just gives you more reasons to override your own rules. You see PCR at one level, max pain at another strike, an OI unwinding alert, a sector heatmap turning red, and a news headline — and you end up doing something you never tested.
The fix is not less data. It is deciding, in advance, which data points are allowed to change your behaviour and how.
Turning Live Analytics Into Filters, Not Signals
There is a hard distinction most traders never make: a signal tells you to enter; a filter tells you when not to.
Most live market analytics — OI build-up, PCR, IV levels, max pain shifts, sector breadth — work far better as filters than as signals. Trying to use PCR as an entry trigger is how people build strategies that backtest beautifully and bleed live.
Volatility as a regime filter
IV is not a directional input. It is a structure-selection input.
A practical way to use it: define two or three volatility buckets for your instrument based on historical IV percentile — say low, normal, and elevated — and pre-decide which strategy families are allowed in each bucket. Debit spreads and directional buying behave very differently at low IV versus elevated IV. A short strangle sized for a normal regime is a different animal in an elevated one.
The rule is boring and that is the point: the regime picks the structure, not your gut.
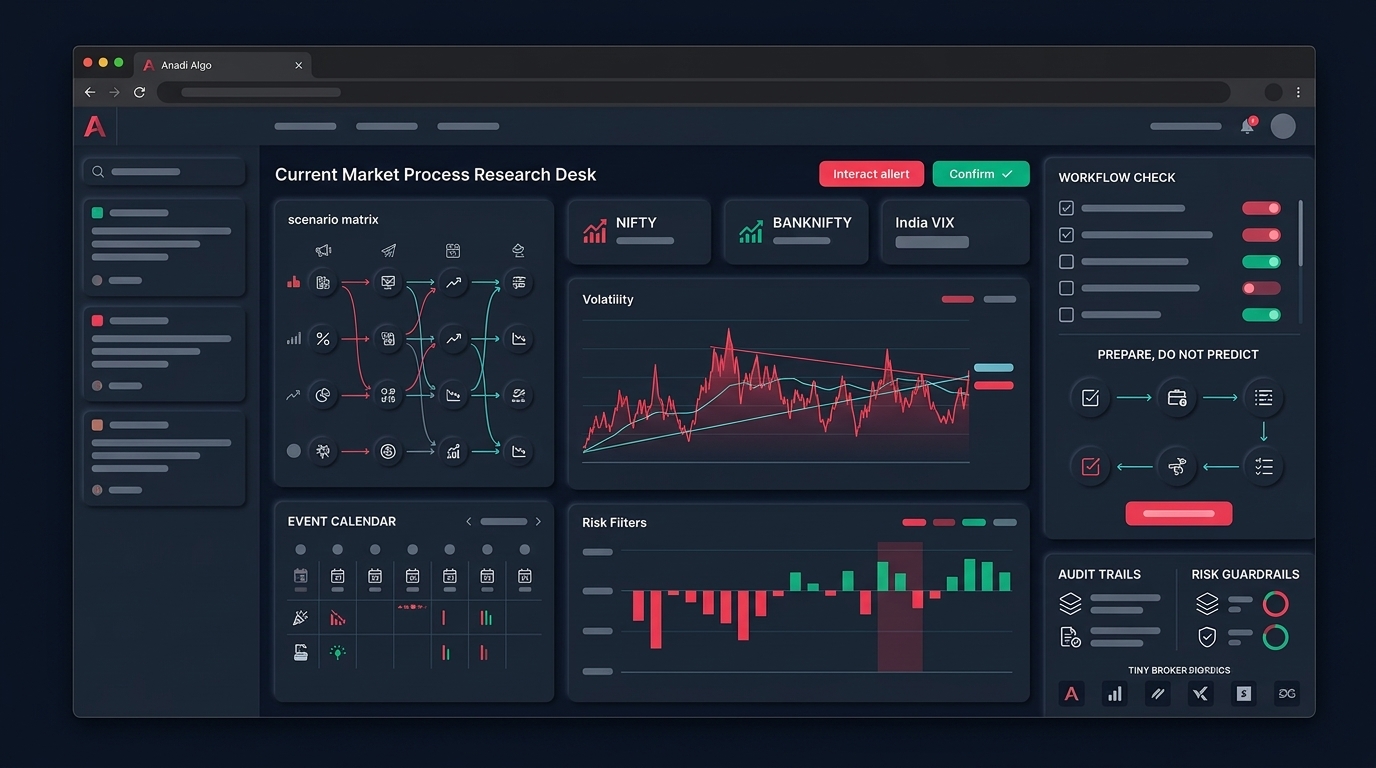
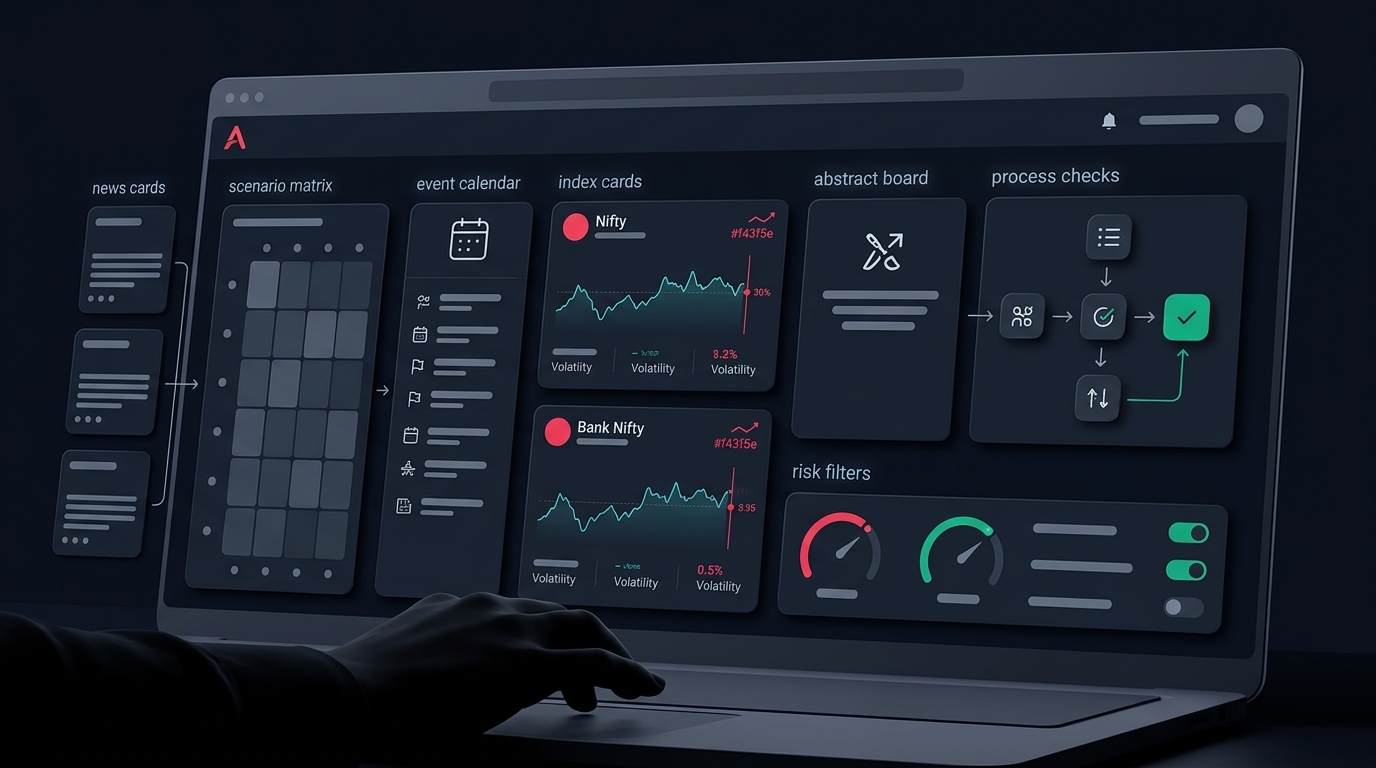
Anadi's options desk keeps IV & Theta as a tab inside the same workspace as the chain, OI, and strategy finder — so the volatility read happens before structure selection, not after the position is already on. That sequencing matters more than the specific number.
Breadth and sector as a veto layer
A single stock setup can look textbook while the broader tape is falling apart. Sector rotation data — NIFTY IT weak while NIFTY Bank is strong, or vice versa — is genuinely useful, but almost never as an entry reason.
Use it as a veto. If your scanner throws a long candidate in a sector that is the day's weakest and index breadth is negative, that is a reason to skip or halve size — not a reason to flip your bias and short.
This is the whole idea behind market breadth and sector rotation for algo traders: breadth confirms or denies; it does not originate.
OI build-up as a context check
Change-in-OI tells you where positions are being added or unwound. It is descriptive, not predictive.
The honest use: after your primary setup fires, check whether OI context contradicts it violently. If your system wants to sell calls at a strike where call OI is unwinding fast on a rising underlying, that is a context conflict worth logging — even if you still take the trade per your rules.
Log it. Over fifty trades, you will learn whether that conflict actually costs you anything. That is how a discretionary observation becomes a testable rule.
Event Avoidance Is A Strategy Component
The single most under-modelled thing in retail backtests is the event calendar.
Indian markets have a predictable rhythm of scheduled volatility: RBI policy days, monthly and quarterly earnings clusters, expiry days for weekly and monthly contracts, Union Budget, global central bank decisions that hit the overnight gap, and macro data prints. Each one has a different signature.
The mistake is treating them all the same. They are not.
- Expiry days compress theta and inflate gamma risk. A strategy that works Monday to Wednesday can behave like a different system on expiry.
- Policy days create a pre-announcement IV build and a post-announcement crush. Direction can be right and the position still loses on the vol collapse.
- Overnight global events show up as a gap, which is the one risk your intraday stop-loss cannot protect against.
- Earnings clusters in stock F&O create single-name vol that leaks into index behaviour through weight.
Build an event calendar into your system as a hard input, not a mental note. The rule can be simple: no new positions in the two hours before a scheduled macro event, or reduce size by half on expiry, or flatten overnight exposure ahead of a known global print.
Whatever you choose, encode it. A rule that lives only in your head gets suspended on the day it matters most.
And test both sides. When you backtest with realistic assumptions, run your strategy with and without event filters. Sometimes the filter costs you more than it saves. You want to know that from data, not from a forum post.
Gap Risk And The Pre-Open Window
GIFT Nifty gives you an overnight read, and the NSE pre-open session from 9:00 to 9:08 AM gives you Indicative Equilibrium Price and volume before the actual open.
Both are useful. Neither is a prediction tool.
The practical use is risk sizing, not direction. If GIFT Nifty is showing a meaningful overnight move, your first question should not be "which way do I trade the gap" — it should be:
- Do I have overnight positions, and what is their mark-to-market at this implied open?
- Does my existing stop-loss still make sense, or has price already blown past it in a way that will fill me far worse than modelled?
- Should today's position size be reduced because realised intraday range is likely to be wider than my system's baseline?
That third one is where most retail systems break. A strategy calibrated on average daily range does not automatically resize when the range doubles. If your sizing is static, a high-volatility day quietly gives you 2x your intended risk.
This is why position sizing rules should reference a volatility measure, not just a fixed lot count. Even a crude ATR-based or IV-based size adjustment beats a constant.
Workflow Checks Before The Order Goes Out
Data and rules mean nothing if the execution layer fails. Here is what actually breaks in live Indian algo trading, and the checks that catch it.
Pre-market checks
- Broker API session is authenticated and token is fresh. Session expiry mid-session is one of the most common silent algo failures.
- Margin available matches what your strategy expects, including any peak-margin implications for multi-leg baskets.
- Instrument master or contract file is updated. Expiry rollovers and contract changes break symbol mapping.
- Your kill switch and daily loss limit are active and correctly valued for today's capital.
Intra-session checks
- Order rejection handling is live — not just logged, but actually reconciling. A rejected leg of a hedged structure leaves you naked.
- Duplicate order protection is on. Webhook retries and reconnection logic are notorious for double-firing.
- Position state in your system matches broker position state. Reconcile, don't assume.
- Data feed heartbeat is alive. A frozen feed looks exactly like a quiet market until it doesn't.
Post-session review
- Compare modelled fill versus actual fill. Slippage on Bank Nifty options in the last thirty minutes is not the same as slippage at 10:30 AM.
- Log every event-day trade separately so it does not contaminate your baseline stats.
- Review blocked or skipped signals. If your filters blocked ten trades and eight would have lost, the filter is working. If seven would have won, investigate.
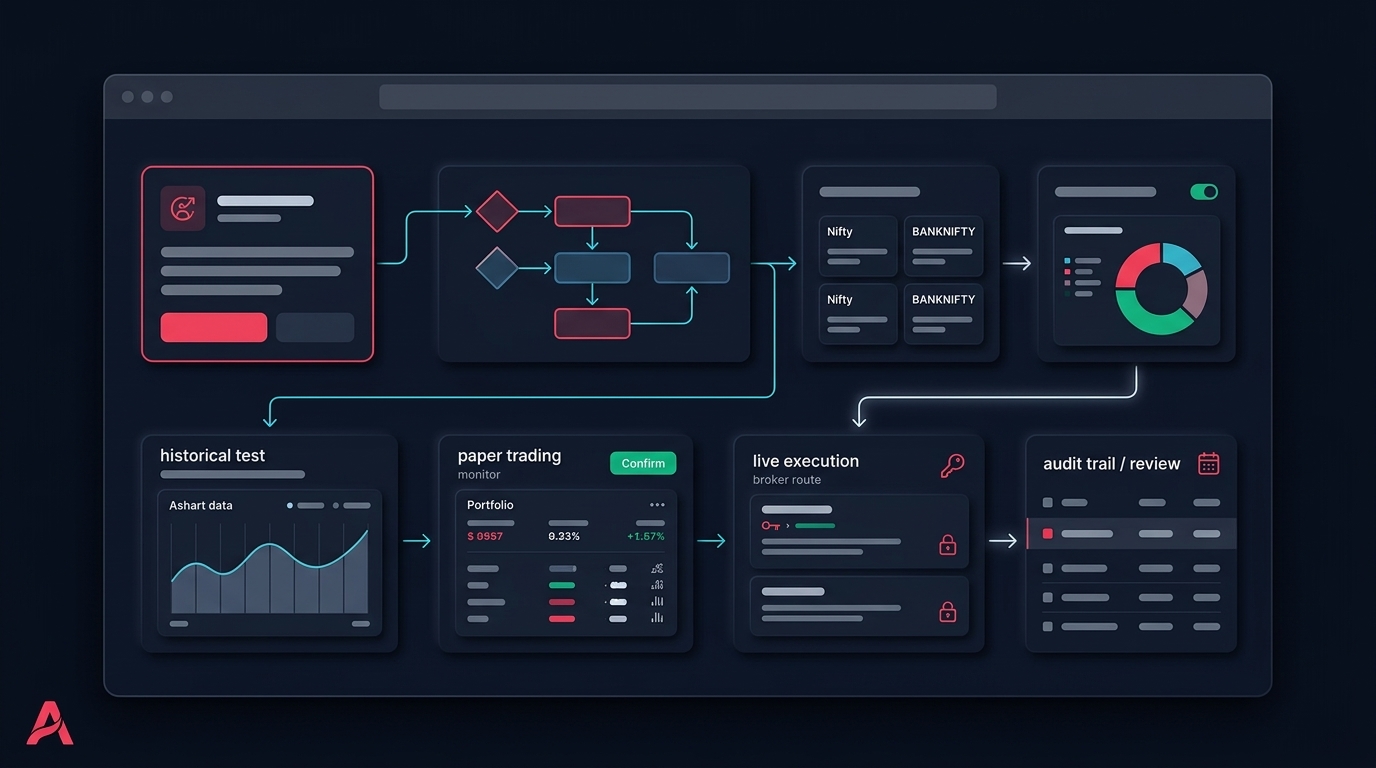
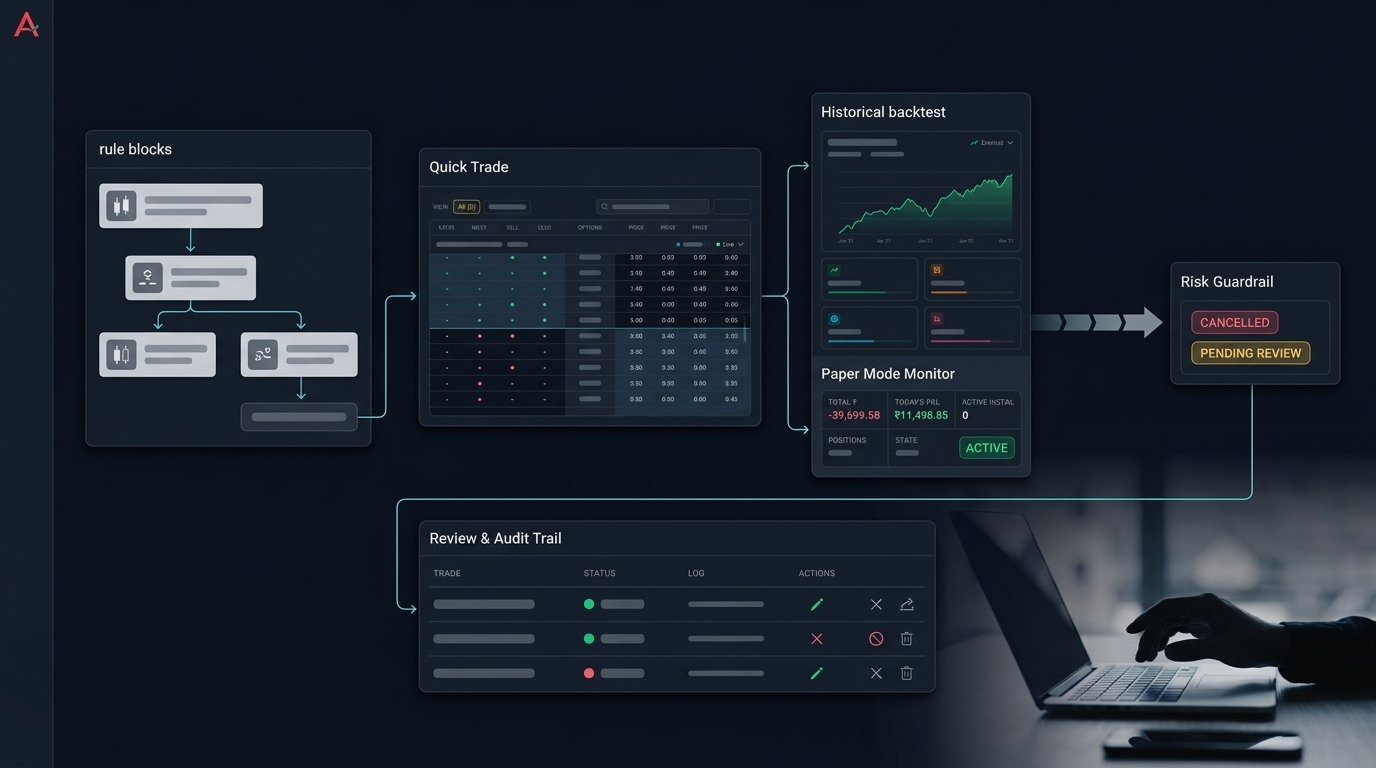
Anadi's Action Center is built around this idea — scanner candidates get ranked with freshness, entry-blocked reasons like chase distance or invalidated price, F&O eligibility, and route choice before anything reaches an order ticket. The point is not the feature list. The point is that the gap between "signal appeared" and "order placed" is where discipline is won or lost.
Multi-Leg Structures Need Basket-Level Risk
Payoff builders across the ecosystem let you drag legs together and see a P&L curve with Greeks. That is genuinely useful for understanding a structure.
What those curves do not show you is execution reality.
A four-leg structure has four fills, four possible rejections, four spreads to cross, and a margin requirement that changes as legs go on. The theoretical payoff assumes simultaneous fill at mid. Live, you get sequential fills at bid/ask.
Practical checks for any multi-leg structure:
- Estimate margin with existing positions considered, not standalone. Hedge benefit only applies if both legs are actually on.
- Define what happens if leg 2 fills and leg 3 rejects. Do you retry, reverse leg 2, or alert and halt? Decide before, not during.
- Set a basket-level stop, not just per-leg stops. A basket stop-loss is what caps damage when legs move against you in a correlated way.
- Model exit slippage separately from entry slippage. Exiting a stressed structure costs more.
What Actually Compounds
None of this is exciting. That is the feature.
The traders who last are not the ones with the best read on today's tape. They are the ones whose process produces the same quality of decision on day 200 as on day 20 — because the decision is made by rules written when nobody was under pressure.
Live analytics from any provider give you the raw material. Your job is to decide, in advance, which of it changes your behaviour.
If you want to build that discipline into a system rather than a checklist you forget under stress, get early access to Anadi Algo and run your rules through backtesting and paper trading before capital is at stake.
The Working Checklist
Print this. Tape it to your monitor.
Before the session
- Volatility regime identified and logged; strategy family matched to regime
- Event calendar checked for today and tomorrow; size or block rules applied
- Broker session authenticated, margin verified, contract master current
- Daily loss limit and kill switch active with today's correct values
Before each entry
- Primary setup fired per written rules — not per screen intuition
- Breadth and sector checked as a veto, not as a reason
- Position size adjusted for current volatility, not a fixed lot count
- Multi-leg failure path defined before the first leg goes out
During the session
- Position reconciliation running against broker state
- Duplicate order protection and rejection handling verified live
- Data feed heartbeat monitored
- No new positions inside your pre-defined event blackout windows
After the close
- Modelled fill versus actual fill logged
- Event-day trades tagged separately from baseline stats
- Blocked signals reviewed — was the filter right or expensive?
- One line in the journal: did I follow my rules, yes or no?
The market will keep producing new data every second. Your edge is not seeing more of it. Your edge is having decided, before the bell, exactly which parts of it are allowed to move your hand.