It is Wednesday, September 9, 2026. With Nifty weekly and monthly expiries running on Tuesdays, yesterday's near-week contracts have settled and the chain you are looking at this morning belongs to a fresh weekly series. Every live option chain page — NSE's own chain, NiftyTrader, broker apps — is showing the same familiar columns: open interest, change in OI, implied volatility, LTP by strike. The layout has not changed. The meaning has.
This is the part most retail algo setups get wrong. A rule like "highest Call OI strike is resistance" or "PCR below 0.7 means bearish positioning" behaves very differently on day one of a series than it does on day six. The numbers are real, the data feed is live, and the rule still fires — but the statistical base underneath it has just been wiped and is rebuilding from near zero.
This post walks through how each chain number changes meaning right after an expiry rollover, and what filters an algo trader should put in front of chain-driven rules on days like today. No forecasts, no levels to trade — just process.
Why the day after expiry is a different chain
When a weekly series expires, all its open positions settle and disappear. The next weekly series has existed as a listed contract for a while, but most participants only build serious positions in it once it becomes the near week. So on the first day of a new series:
- Total OI in the near-week chain starts from a low base and builds through the session.
- Writers who defended strikes in the expired series have not necessarily re-established the same strikes in the new one. Some roll, some wait, some change their view.
- Summary statistics computed from the chain — put-call ratio, max pain, "OI support and resistance" — are being calculated on this thin, shifting base.
A chain page might show, for example, a PCR of 0.65 with heavy Call OI at a round strike. In the middle of a mature series, that snapshot reflects thousands of crores of committed positioning. On the morning after expiry, the identical snapshot can reflect a fraction of that commitment — a structure that one large participant can reshape before lunch. Same number, different weight of evidence.
If your system consumes chain data, "days since series start" is a real variable. Most retail algos do not model it at all.
How each chain number changes meaning on day one
OI walls: support and resistance strikes
The standard reading: the strike with the highest Call OI is the working resistance where writers are selling aggressively; the highest Put OI marks working support. That reading is most reliable when OI has accumulated over days and writers have defended those strikes through price tests.
On day one, the "walls" are scaffolding, not concrete. The highest-OI strike can migrate two or three times during the session as rollover positions land. An algo that anchors stop-loss or entry logic to the morning's OI wall is anchoring to a structure that may not exist by 1 PM.
Process fix: treat OI walls as provisional until absolute OI at that strike crosses a minimum threshold you have calibrated from history — for instance, a percentage of what the previous series' dominant strikes typically carried at the same time of day. The exact number is yours to derive from a backtest; the principle is that a wall needs mass before it deserves algo weight.
Change in OI
Change in OI is usually the sharpest column on the chain because it isolates fresh positioning from stale carry. The NiftyTrader-style guidance — a strike adding OI intraday matters more than one carrying old positions — is correct in a mature series.
On day one, almost everything is fresh. Every strike shows large percentage OI additions because the base is tiny. A rule like "alert when OI at a strike rises 40 percent intraday" will fire across half the chain and tell you nothing. The signal-to-noise of change-in-OI is at its weekly worst exactly when the percentages look most dramatic.
Process fix: on the first day of a series, switch change-in-OI logic from percentage terms to absolute contract terms, or suppress it entirely until total series OI crosses your minimum. Din ek ke percentages pe bharosa mat karo — they are arithmetic artefacts, not conviction.
Put-call ratio
PCR is a ratio, and ratios computed on small denominators swing wildly. A day-one PCR of 0.65 and an expiry-week PCR of 0.65 are not the same observation, even though your data logger records them identically. Early in a series, a handful of large writes on one side can move PCR several points of a decimal without representing broad positioning.
Process fix: log PCR with a series-age tag alongside it. If any strategy consumes PCR as an input or filter, its thresholds should be conditioned on series age — or the strategy should simply ignore PCR for the first session. When you backtest a PCR-based filter, check whether its edge survives after you exclude day-one readings. Often the "edge" was concentrated in noisy early-series data that live trading will not reward.
Implied volatility
IV around expiry does two things worth separating. Into expiry, near-week IV behaves erratically as time value collapses. After expiry, the new near week reprices — its IV now reflects a full week of event exposure rather than hours.
That means comparing this morning's ATM IV to yesterday's is comparing two different contracts with different lives. An algo rule like "enter premium-selling structure when IV is above its 5-day average" silently mixes series and produces a threshold that means nothing across the rollover boundary.
Process fix: compute IV baselines per series, or use a constant-maturity interpolation if your data pipeline supports it. At minimum, exclude the expiry-to-day-one transition from any rolling IV average. Also compare IV at your strike against neighbouring strikes in the same expiry — buying options at locally inflated IV means the trade has to overcome both direction and volatility decay, and that check works on any day of the series.
LTP, spreads and liquidity
Liquidity concentrates in the near week, but it takes time to migrate after a rollover. On day one, quoted spreads at strikes away from ATM can be meaningfully wider than they will be by Thursday or Friday. For a manual trader that is an annoyance; for an algo placing market orders or aggressive limits, it is a direct cost that backtests built on close prices never show.
Process fix: put a spread filter in front of execution — reject entries where the bid-ask spread exceeds a defined percentage of premium — and log actual fills against mid-price so you can see what day-one liquidity really costs you. This belongs in your risk management layer, not in the strategy logic, because it should protect every strategy uniformly.
Day-one risk filters worth coding
Pulling this together into checks an algo trader can actually implement. These are process examples to calibrate, not prescriptions:
- Series-age gate. Tag every session with days-since-series-start and days-to-expiry. Any rule that consumes OI, change-in-OI, PCR, or max pain checks this tag first and either adjusts thresholds or stands down on day one.
- Minimum OI mass before "walls" count. Do not let the algo treat a strike as support or resistance until absolute OI there crosses a calibrated floor.
- Absolute, not percentage, OI change early in a series. Percentage-based OI alerts stay off until total chain OI normalises.
- Per-series IV baselines. Never let a rolling IV average straddle an expiry boundary without adjustment.
- Spread and liquidity filter at execution. Reject or downsize entries when spreads are wide relative to premium, whatever the signal says.
- Verify the expiry calendar, don't assume it. Confirm on the exchange chain which expiries are actually listed for Nifty and Bank Nifty this week rather than hardcoding a weekday. Holiday shifts and contract-rule changes have burned plenty of hardcoded algos. This is also where Nifty and Bank Nifty diverge — their expiry structures are not interchangeable, so a chain-reading rule built for one should not be silently applied to the other.
- Event awareness before sizing. A new weekly series carries the full week's scheduled events — data releases, policy meetings, global cues. The point is not to predict outcomes but to know what the week holds before your position sizing does. A weekly market outlook review at series start is preparation; reacting to headlines mid-trade is noise-chasing.
What this means for backtesting
If you backtest chain-driven strategies, the day-one problem shows up as a data problem before it shows up as a P&L problem.
Most historical option datasets give you OI, IV, and prices per contract per day. If your backtest pools all sessions together — day one of a series next to expiry day — every threshold you derive is an average across regimes that behave differently. The strategy then looks stable in aggregate while actually being two strategies: one that works mid-series and one that bleeds early-series.
The fix is cheap: add series-age as a column, then re-run your analysis grouped by it. Look at your rule's hit rate and average outcome on day one versus days two through expiry. If performance is materially worse early in the series, encode that as a filter rather than hoping live markets will be kinder than the data. Our post on backtesting Nifty options without fooling yourself covers the broader honesty checklist; series-age segmentation belongs on it.
Where this sits in a workflow
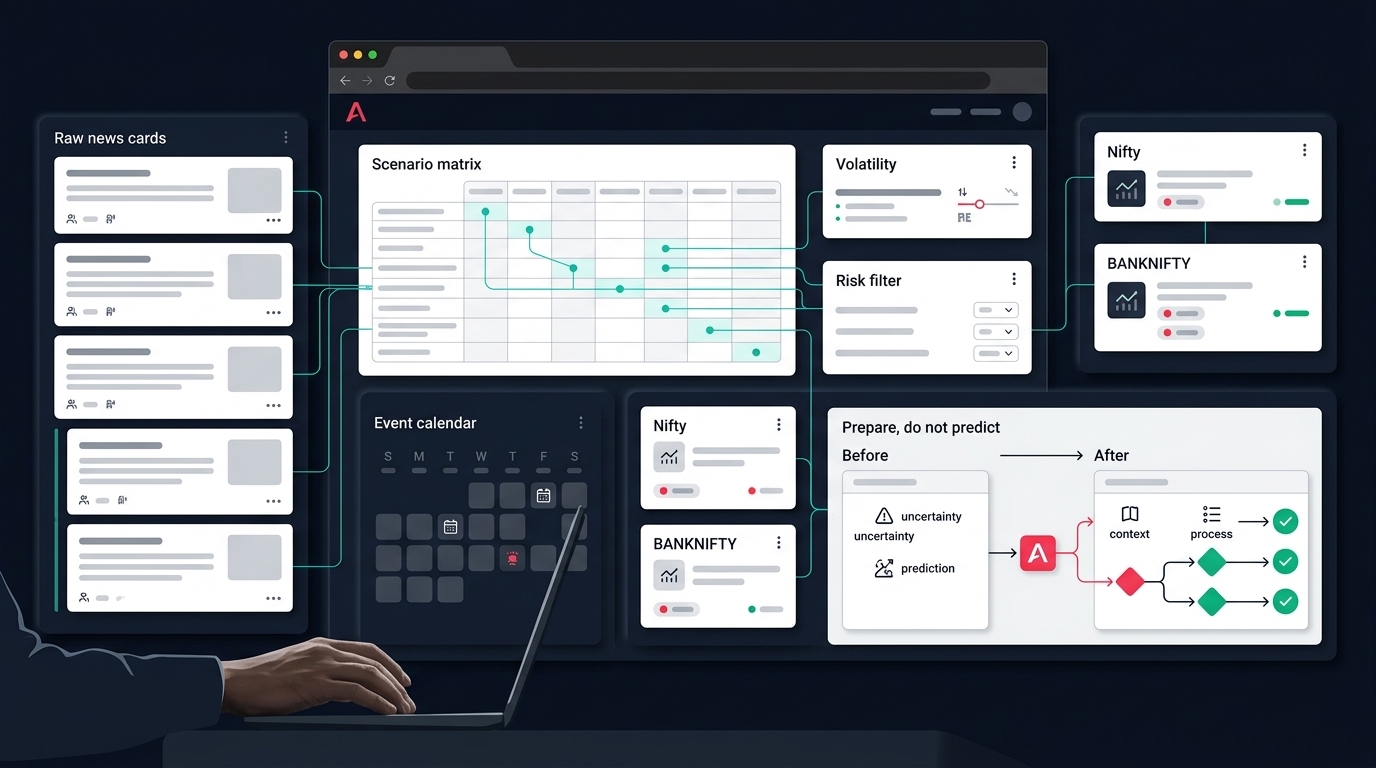
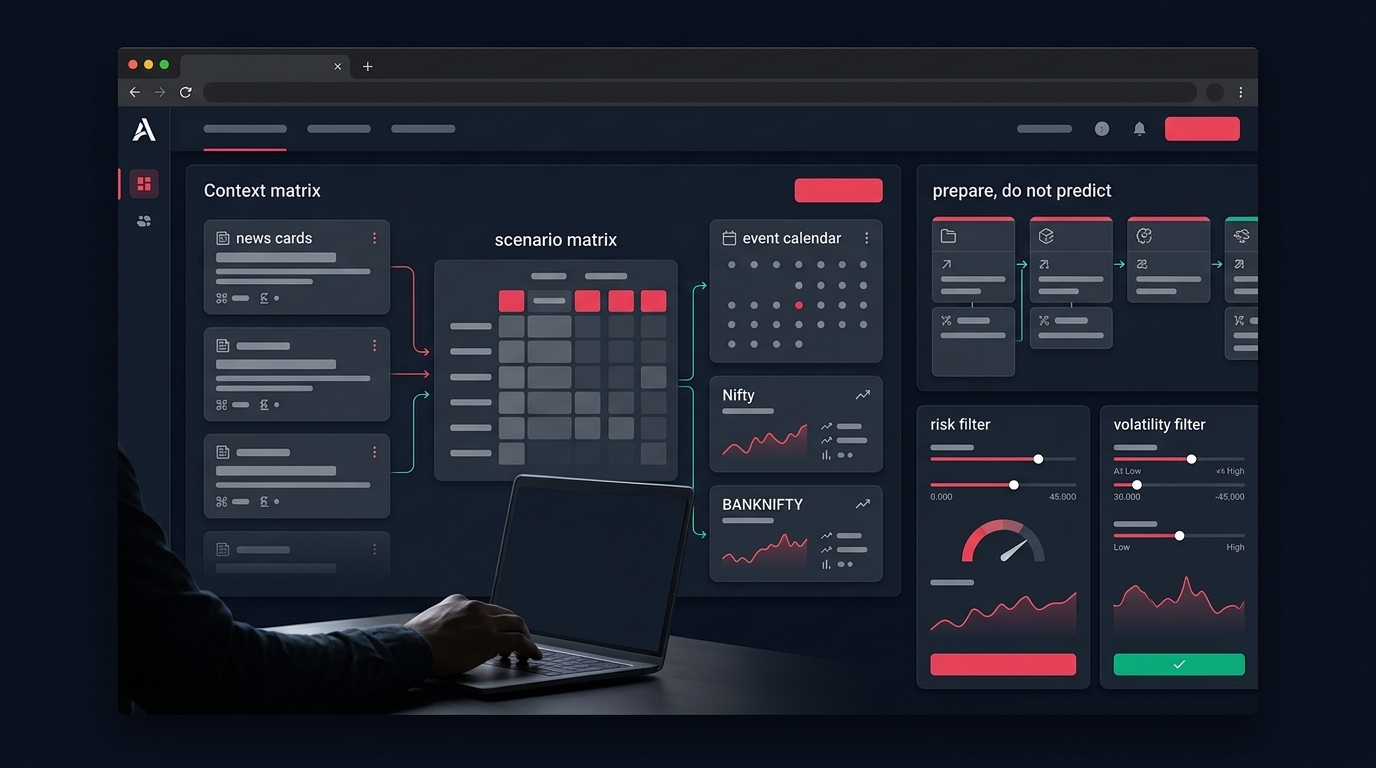
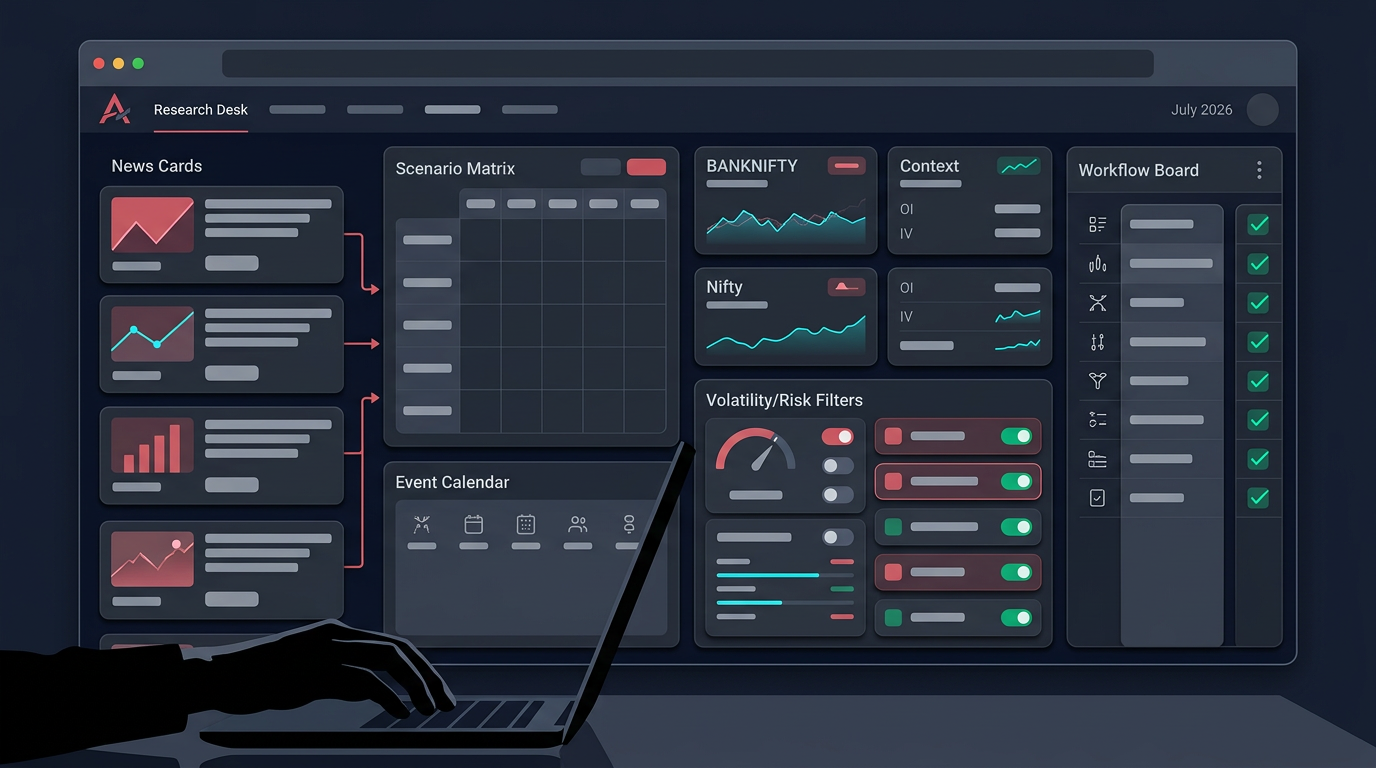
The reason this matters for workflow design: reading a chain correctly on day one requires holding several contexts at once — the chain itself, where fresh OI is building, IV and theta conditions, and the broader index tape.
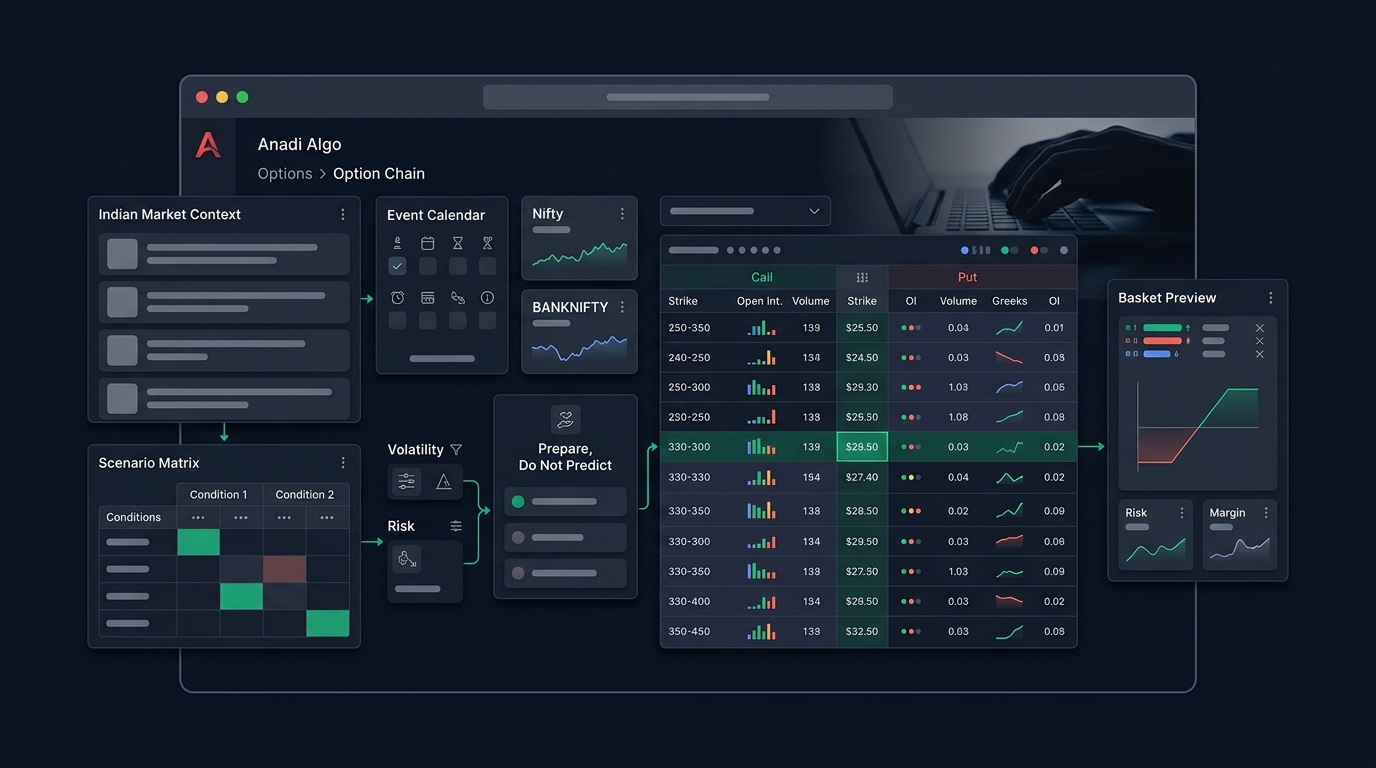
This is how the Anadi options workspace is arranged. The option chain view sits beside OI analysis and a dedicated IV and theta tab, so volatility and decay context is visible before structure selection rather than discovered after entry. Chain rows connect to basket previews with margin estimated before execution, which matters more than usual when day-one spreads make fill quality uncertain. And index and sector context frames whether a chain reading even deserves attention — a provisional OI wall in a weak breadth tape is a different object from the same wall with sector confirmation. If you are building rules rather than clicking trades, the same discipline applies inside a strategy builder: the series-age gate and spread filter above are just conditions like any other, and they belong in the rule, not in your memory.
None of this makes day one tradeable or untradeable. It makes it legible — you know which numbers to trust, which to discount, and which to log for later.
Day-one chain checklist
Before your algo acts on the Nifty option chain on the first day of a new weekly series:
- Confirmed actual listed expiries on the exchange chain, not assumed from the calendar
- Series-age tag active; OI, PCR, and max-pain rules on adjusted thresholds or standing down
- OI walls treated as provisional until absolute OI crosses your calibrated floor
- Change-in-OI logic switched to absolute terms
- IV baselines computed per series, no averages straddling the expiry boundary
- Spread filter live at execution; fills logged against mid-price
- Week's scheduled events reviewed once, at series start, and reflected in sizing rules
The chain page looks identical every morning. The discipline is knowing which morning it is.
If you want this kind of process — chain inspection, OI context, IV and theta checks, and risk filters in one place instead of five browser tabs — request early access to Anadi Algo and build the checks into your workflow before the next series starts.