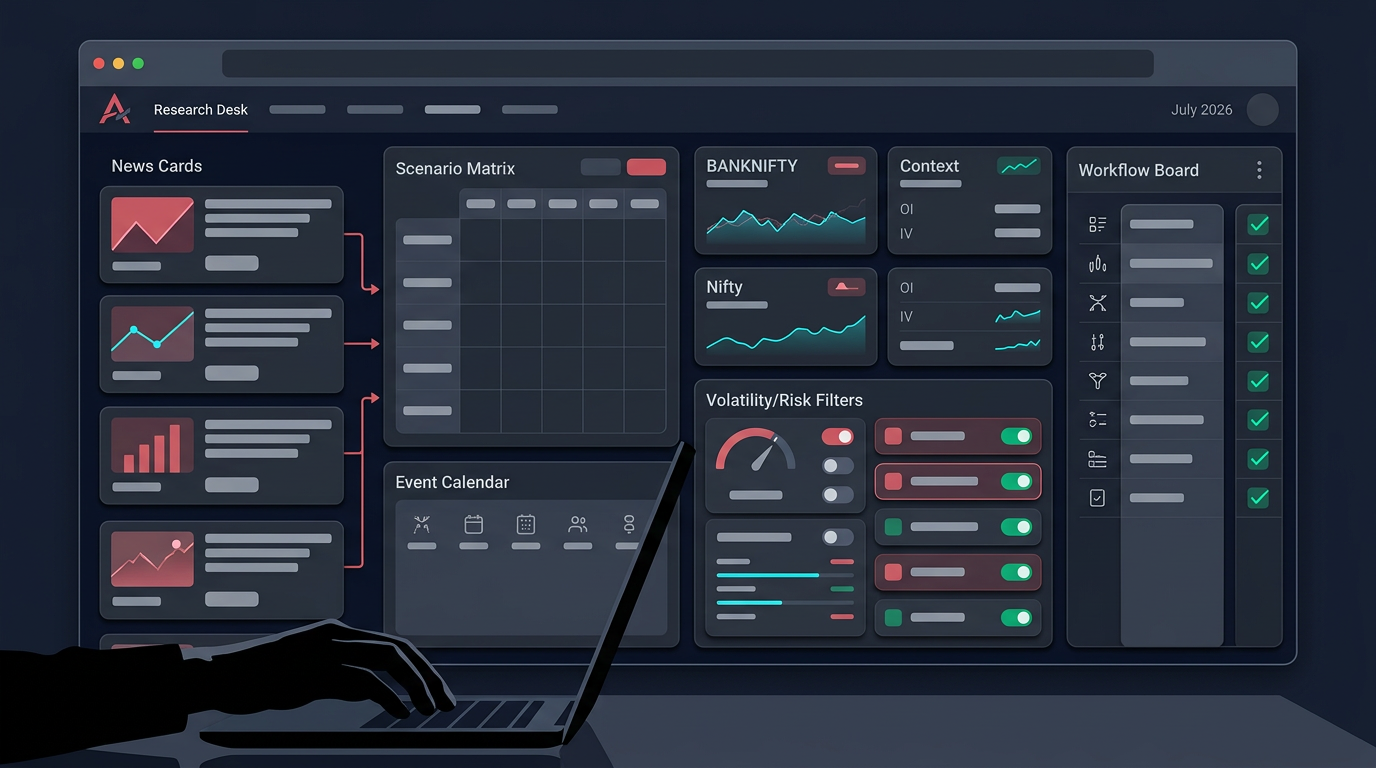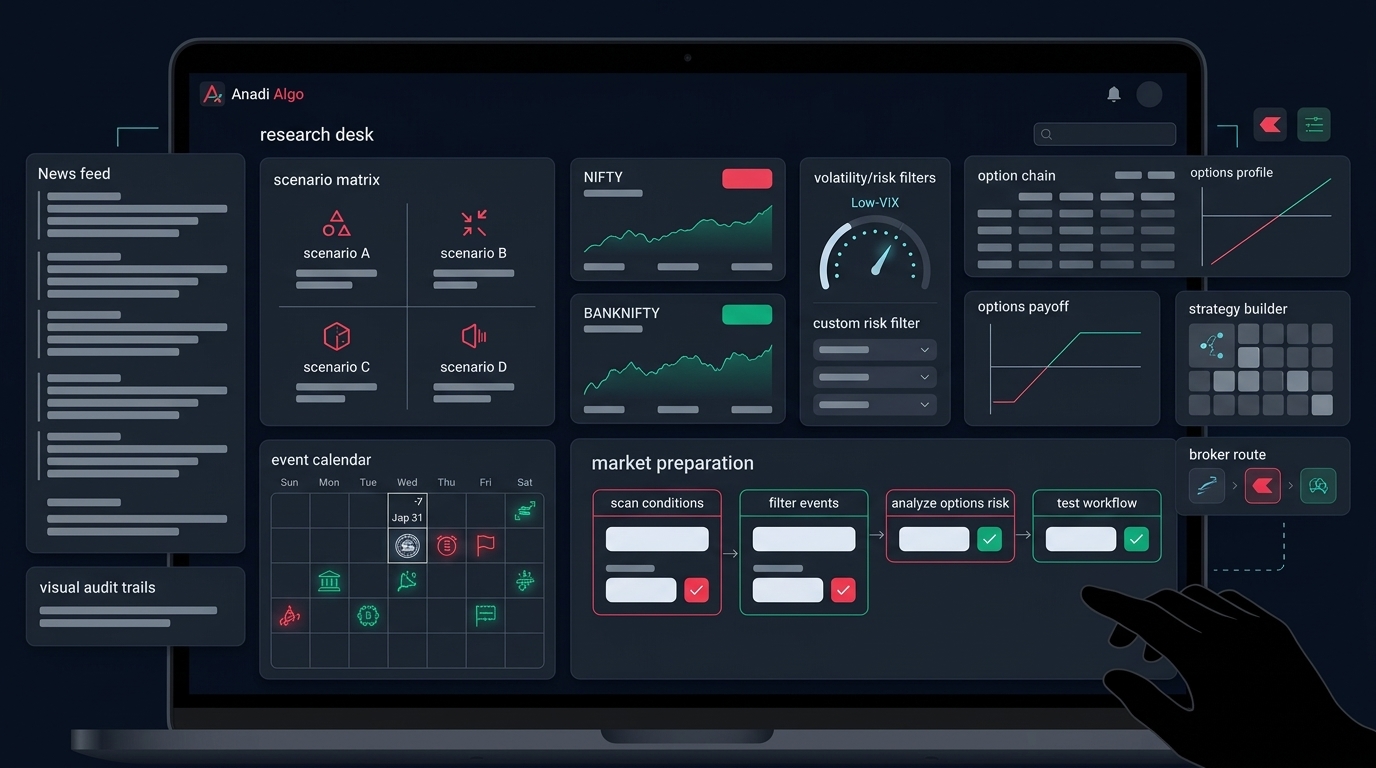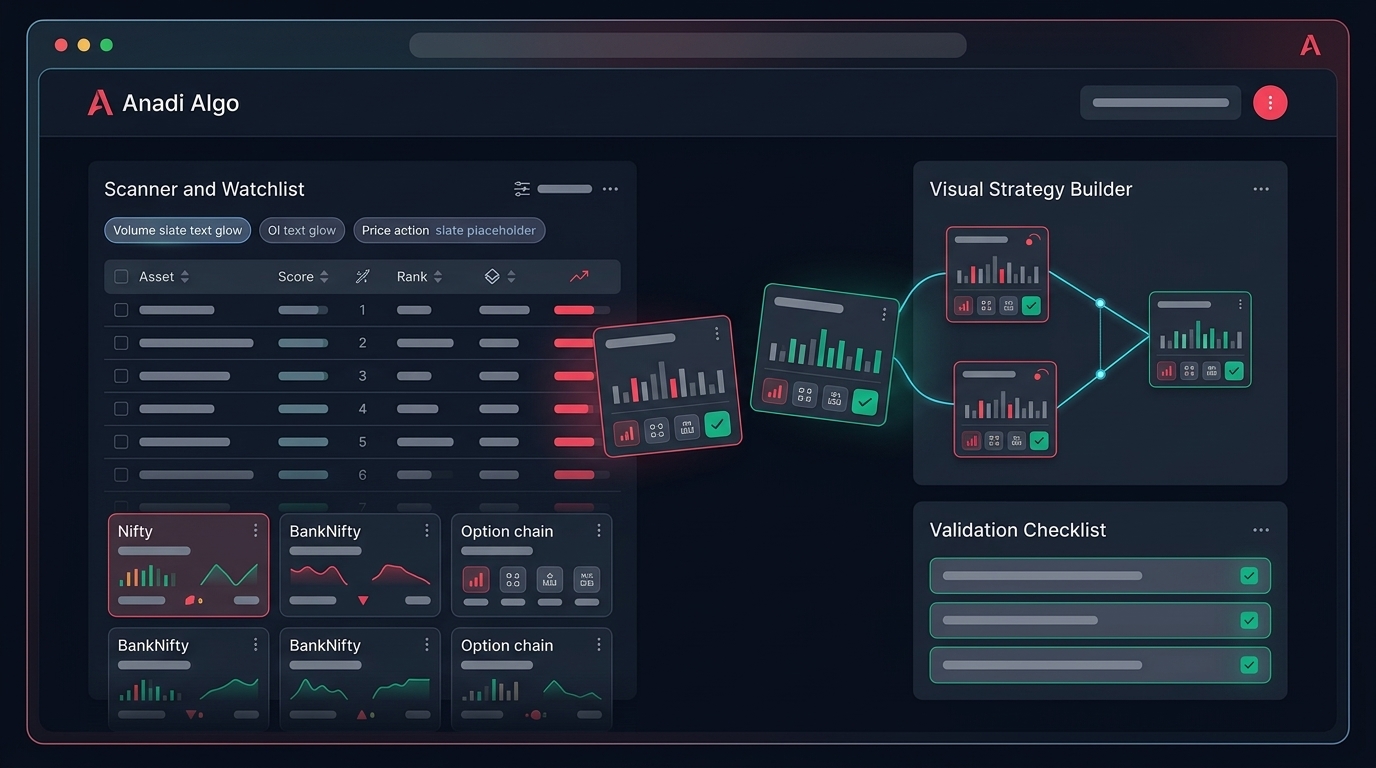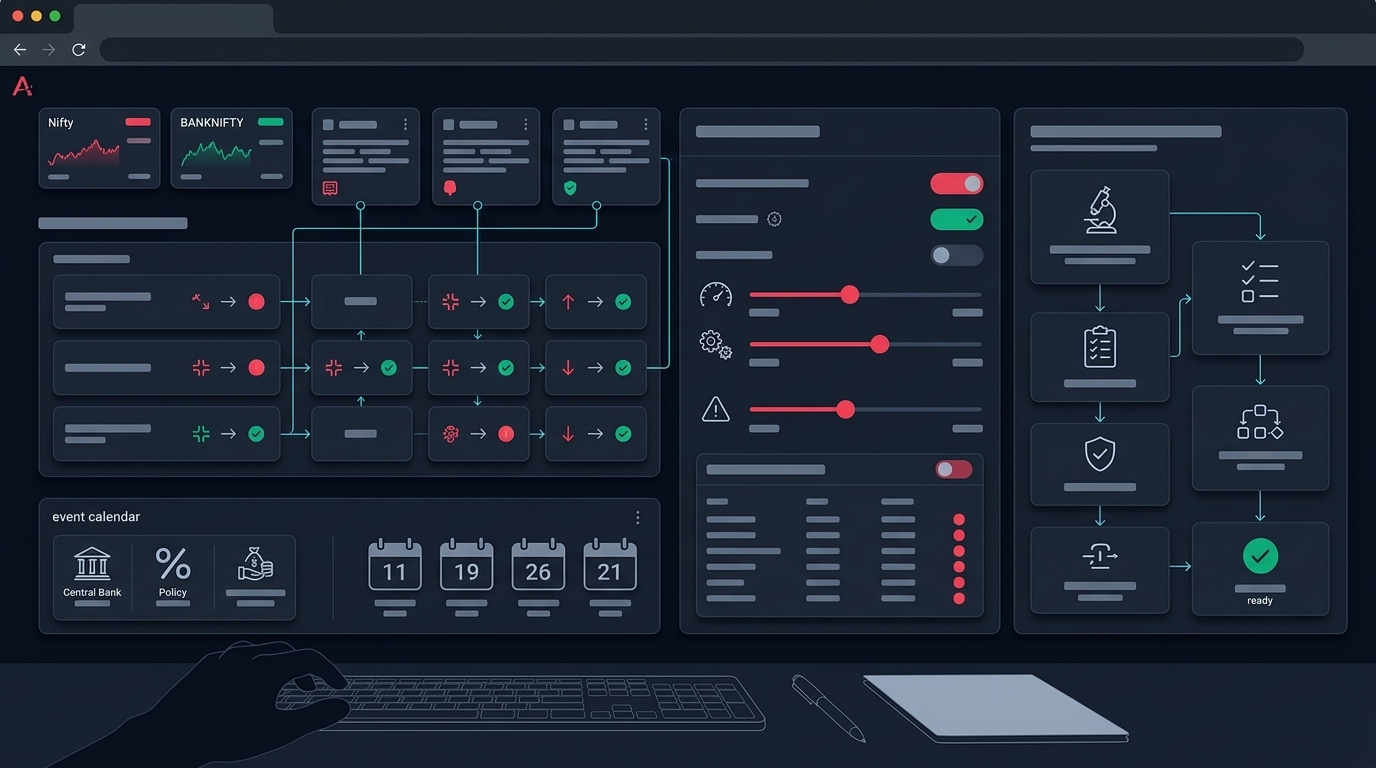
Open the NSE option chain page in the middle of an active August 2026 session and it feels like a live terminal. Strikes streaming, OI columns shifting, IV flickering, a PCR number sitting at the top like a verdict. Most retail traders treat that page as the market's opinion.
For an algo trader, that is the wrong frame. The option chain is a data source with specific properties — a refresh behaviour, a timestamp, a settlement type, a lot size, an expiry calendar — and every one of those properties is an input your system depends on. Get the reading wrong and you lose a trade. Get the data plumbing wrong and you lose the same trade repeatedly without understanding why.
This post is about the second problem, which almost nobody writes about. No predictions, no trade calls. Just what the NSE chain actually is, how index and stock chains differ, and what to check before an expiry-heavy week.
What the NSE option chain page actually is
Start with the thing itself. The official NSE Option Chain is a public web view over exchange derivatives data, and it is broader than most traders realise. It carries separate chains for equity derivatives, currency derivatives, G-sec, and commodities derivatives. Within equity derivatives you pick an underlying — NIFTY, BANKNIFTY, FINNIFTY, MIDCPNIFTY, NIFTYNXT50, or an F&O stock — then filter by expiry date or strike price.
Three details on that page matter more for automation than any OI number:
- A streaming toggle. The page can run in streaming mode or static mode. What you see refreshing on screen is not necessarily what a script scraping the same endpoint receives.
- A "Today / Previous Trade Day" switch and an indicative close. Some values are indicative rather than final. Intraday OI is provisional and gets revised in end-of-day reports.
- An "as on" timestamp. This is the single most important field on the page and the one traders ignore completely.
There is also a CSV download, which is genuinely useful for research and genuinely dangerous as a production dependency. A file you pull manually at 3:20 pm is a snapshot of one moment, not a series.
The practical consequence: the NSE chain is excellent for verification and study, and a poor primary feed for live automation. If your strategy acts on chain data, it should consume it through a proper broker API or licensed data feed, and use the exchange page to sanity-check what that feed is telling you. Mixing the two — eyeballing a website while your code polls something else — is how traders end up debugging a "strategy bug" that is really a data mismatch.
Index chains and stock chains are different animals
The chain layout looks identical whether you load NIFTY or a single stock. The behaviour underneath is not, and a system written for one will misbehave on the other.
Index chains
Nifty and Bank Nifty chains are deep, heavily writer-dominated, and cash-settled. Liquidity is spread across many strikes, spreads at near-the-money strikes are usually workable, and there is no delivery obligation at expiry. This is why index chains are the default playground for intraday and expiry-day option structures, and why most retail option content is implicitly about them.
Because they are cash-settled, the end of an index option's life is a settlement calculation, not a stock transfer. Your risk near expiry is about gamma and pricing, not about receiving shares.
Stock F&O chains
Stock chains are thinner, more event-driven, and physically settled. Three things change as a result:
- Positions unwind earlier. Traders exit ahead of expiry to avoid delivery obligations, so behaviour in the final sessions is different from an index.
- OTM liquidity dries up faster. A strike that quoted reasonably on Monday can be a wide, thin quote by expiry week. Your assumed fill price is fiction well before your stop is hit.
- Events dominate. Results, sector news, and F&O ban-list entry can change a stock chain's character overnight. Ban-list status in particular is a hard constraint — fresh positions get restricted, and a system that does not check it will generate rejections.
If your scanner surfaces stock F&O candidates alongside index setups, those two paths need different rules. Anadi's Action Center handles this by enriching eligible symbols with F&O context — future preview, option context, OI pulse, daily OI, VWAP gate, basis, PCR — and by showing an explicit route choice between stock, future, and option before anything reaches execution. The point is that the route decision is made consciously, not inherited from whichever template you used last time.
Contract specs are system inputs, not trivia
This is where a surprising number of live algo failures actually originate.
Lot sizes differ across underlyings and get revised. Public chain snapshots from recent sessions show values in the range of 65 for Nifty, 30 for Bank Nifty, 60 for FinNifty, and 120 for MidcpNifty — but the specific number is not the lesson. The lesson is that these are exchange-set values that change, and that your position-sizing code almost certainly has one of them written down somewhere.
Same story with expiry days. Public chain listings currently show Nifty weekly and monthly expiries on Tuesday, and index expiry schedules in India have been revised more than once in recent years. If your backtest, your scanner filter, and your live scheduler each encode "expiry day" independently, a schedule change silently desynchronises them.
Two rules that prevent most of this damage:
- Never hardcode a contract spec. Lot size, tick size, and expiry date should be read live from the instrument master your broker or data provider publishes, at the start of every session.
- Verify against the exchange before an expiry-schedule assumption goes into production. Not a blog post, not a forum thread — the current circular or the live chain itself.
A wrong lot size does not produce an error message. It produces a position that is 2x or half the size you intended, with your risk limits calculated on the wrong base. That is a risk management failure disguised as a data problem.
Expiry-week volatility: what changes mechanically
Search interest around "Nifty Bank Nifty expiry volatility today" spikes because expiry weeks genuinely behave differently. But the useful description is mechanical, not directional.
As time to expiry shrinks, gamma rises. Small underlying moves produce disproportionate changes in option value and in your position's delta. A short-premium book that behaved calmly for four sessions can see its risk profile change materially within minutes. Nothing about the market "changed" — the maths of the contract did.
Alongside that, three practical effects show up:
- Spreads widen during fast moves. A fill assumption that holds at 11 am may not hold in the closing hour of an expiry session.
- Liquidity migrates toward near-the-money strikes. Far strikes that looked tradable earlier in the cycle get thin.
- Event overlap compounds everything. An expiry session that coincides with a policy decision, an inflation or jobs print, or a major global cue is a different risk environment from a quiet mid-cycle expiry.
None of this tells you what price will do. All of it tells you how your system should behave: smaller size into expiry, an entry cutoff time rather than trading to the bell, and a calendar gate that blocks new entries around scheduled high-impact events. Use a weekly market outlook to build that calendar in advance — as preparation, not as a directional call.
The chain numbers that get over-read
Briefly, because this is where most chain content stops and where most chain-based rules break.
Max pain is a calculation over current open interest, not a magnet. It moves as OI moves. Treating it as a target is reasoning backwards from a number that is itself downstream of positioning.
PCR has no fixed meaning. The same value reads bullish in one tutorial and contrarian-bearish in the next. It carries information only relative to its own recent range, which is why a percentile band over a rolling lookback is a more stable filter than a hardcoded threshold.
IV describes what a move costs, not whether one is coming. High IV means your directional bet is expensive; it is best used as a state variable that decides which structure fits, not whether to trade at all.
Change in OI is more informative than absolute OI, because it isolates fresh positioning from stale carry. But remember it is provisional intraday. A rule that fires on an exact OI threshold can trigger on a figure that is later revised.
The common thread: these are all descriptive. Let them confirm or veto a price-based setup. Do not let them originate one.
Where the chain fits in a working workflow
A sane sequence, regardless of platform:
- Context first. Check index and sector conditions before anything else. A clean single-stock setup inside a weak sector tape is a different trade from the same setup with breadth behind it — which is exactly what an indices and sector heatmap view is for.
- Narrow the candidates. A scanner produces candidates. It does not produce trades. Freshness, signal stage, and blocked reasons like chase distance matter more than raw signal count.
- Inspect the chain. Only now open the option chain for the shortlisted underlying — verify liquidity at the strikes you actually want, check where fresh OI is building, compare IV at your strike against its neighbours.
- Choose structure against view, risk, and capital. Not against a strategy name you like. A strategy finder that ranks by match, capital fit, max loss, and theta forces that ordering.
- See risk and margin before execution. Basket preview and margin estimate with existing positions considered, then the order — not the other way round.
Anadi keeps these steps inside one options workspace precisely so the chain is inspected in context rather than in a separate browser tab. But the sequence matters more than the tool. If you are stitching a public chain page, a spreadsheet, and a broker terminal together manually, the gaps between them are where errors live.
Test the rule before you trust it
Every chain-derived rule — an IV regime gate, a PCR percentile band, an OI confirmation layer, an expiry-week size reduction — is a hypothesis until it survives history with honest assumptions.
Options backtesting on Indian indices punishes shortcuts. Mid-price fills flatter every short-premium system. Flat per-trade slippage hides exactly the expiry-day cost you are trying to model. And a filter tested only on the sample where you noticed it is curve-fitting with extra steps.
Run the base strategy with and without each filter. If the filter helps in one regime and hurts in another, it is an opinion, not a filter. If you are building index structures specifically, a BANKNIFTY strategy builder lets the chain logic and the risk rules live in the same place you test them, which keeps the tested version and the live version from drifting apart.
If you want to wire these checks into one workflow instead of maintaining them across three tools, you can request early access and test it against your own rules.
Expiry-week checklist
Before your system trades on option chain data:
- Feed source is single and known. Chart, chain, and execution layer all agree on where data comes from, and you know its latency.
- Timestamp is part of the decision. Any OI, IV, or PCR value is treated as "as of" a time, not as a permanent truth.
- Contract specs read live. Lot size, tick size, and expiry date pulled from the instrument master each session — never hardcoded.
- Index vs stock path is explicit. Cash-settled index logic and physically-settled stock logic do not share the same expiry rules.
- Ban-list gate active. Stock F&O candidates checked before order generation, not after rejection.
- Event calendar gate active. New entries blocked around scheduled high-impact events and expiry-event overlaps.
- Liquidity verified at your strike. Actual spread checked, not assumed from the strike's appearance in the chain.
- Size scaled to gamma. Position size reduced as days to expiry fall, with an entry cutoff time defined in code.
- Filter backtested in isolation. With realistic spreads and volatility-scaled slippage, across more than one regime.
The NSE option chain is one of the best free data resources Indian retail traders have. It is also one of the easiest to over-trust, because it looks authoritative and updates in real time. Treat it as an instrument specification and a positioning snapshot, verify what your code actually consumes, and let a tested process decide when to act.