Most backtests fail live for one boring reason: the trader read the gross PnL and stopped there. The equity curve looked smooth, the win rate looked healthy, and nobody subtracted what it actually costs to get in and out of a trade. In Indian options especially, those costs are not a rounding error. They decide whether the edge survives.
This is the gap between a backtest that looks profitable and a system that stays profitable.
Why gross PnL is not enough
Gross PnL answers one question: did my entry and exit prices move in my favour? That is a real signal, but it is not your bank balance.
Between the fill and the money that lands in your account sit two forces:
- Explicit costs you can look up: brokerage, STT, exchange transaction charges, GST, stamp duty, SEBI turnover fees.
- Implicit costs you cannot see on a chart: slippage — the difference between the price your backtest assumed and the price you actually got.
A strategy that clears these is a business. A strategy that only clears gross is a spreadsheet.
The cost stack in Indian options
Charges you can look up
Every options trade in India carries a stack of statutory and broker charges. The exact numbers change and vary by broker, so pull them from your broker's contract note or a brokerage calculator rather than guessing. What matters for a backtest is that you model the full round trip, not just brokerage:
- Brokerage (often a flat per-order fee)
- STT, which is a meaningful line item for high-turnover intraday systems
- Exchange transaction charges
- GST on brokerage and transaction charges
- SEBI turnover fee and stamp duty
The point is simple: for a high-turnover intraday options system, the charge stack per round trip can quietly eat a large share of a small per-trade edge.
Slippage, the cost nobody logs
Slippage is where most backtests lie to you. Your backtest fills at the candle close, or the exact signal price. Live, you fill at whatever the order book offers when your order arrives.
Common sources of slippage in Indian options:
- Wide bid-ask spreads, especially on far strikes, weekly expiries near expiry, and low-liquidity stock options.
- Fast moves around the 9:15 open, news, RBI policy, and expiry-day gamma, where the quote you saw is gone by the time you transact.
- Market orders vs limit orders. Market orders guarantee a fill but not a price. Limit orders control price but may not fill at all, and a missed fill is its own hidden cost your backtest never records.
A single BANKNIFTY option quoted at ₹200 that fills at ₹201 on entry and ₹199 on exit has cost you ₹2 of round-trip slippage per unit before any charge. That sounds trivial. Multiply by the lot size, then by 40 trades a month, and it becomes the difference between a green and a red month.
A worked example: from gross to net
Take an intraday options strategy whose backtest reports ₹1,200 average gross profit per trade across 250 trades — a tidy ₹3,00,000 gross.
Now layer in reality (illustrative figures, use your own):
- Assume round-trip charges of ₹250 per trade.
- Assume slippage of ₹300 per trade across all legs.
Net per trade drops to ₹1,200 − ₹550 = ₹650. Across 250 trades that is ₹1,62,500 — still positive, but nearly half the headline number vanished.
Now imagine the average gross edge was ₹600 instead of ₹1,200. The same ₹550 of friction turns a "profitable" backtest into a coin flip or worse. That is the whole lesson: costs do not just shave the edge, they can erase it.
How to model costs in a backtest
Set a realistic fee assumption
Do not use zero. Do not use "brokerage only." Model the full charge stack per trade, and if your platform lets you set fees in basis points or a flat per-trade amount, calibrate it against a real contract note from a live trade.
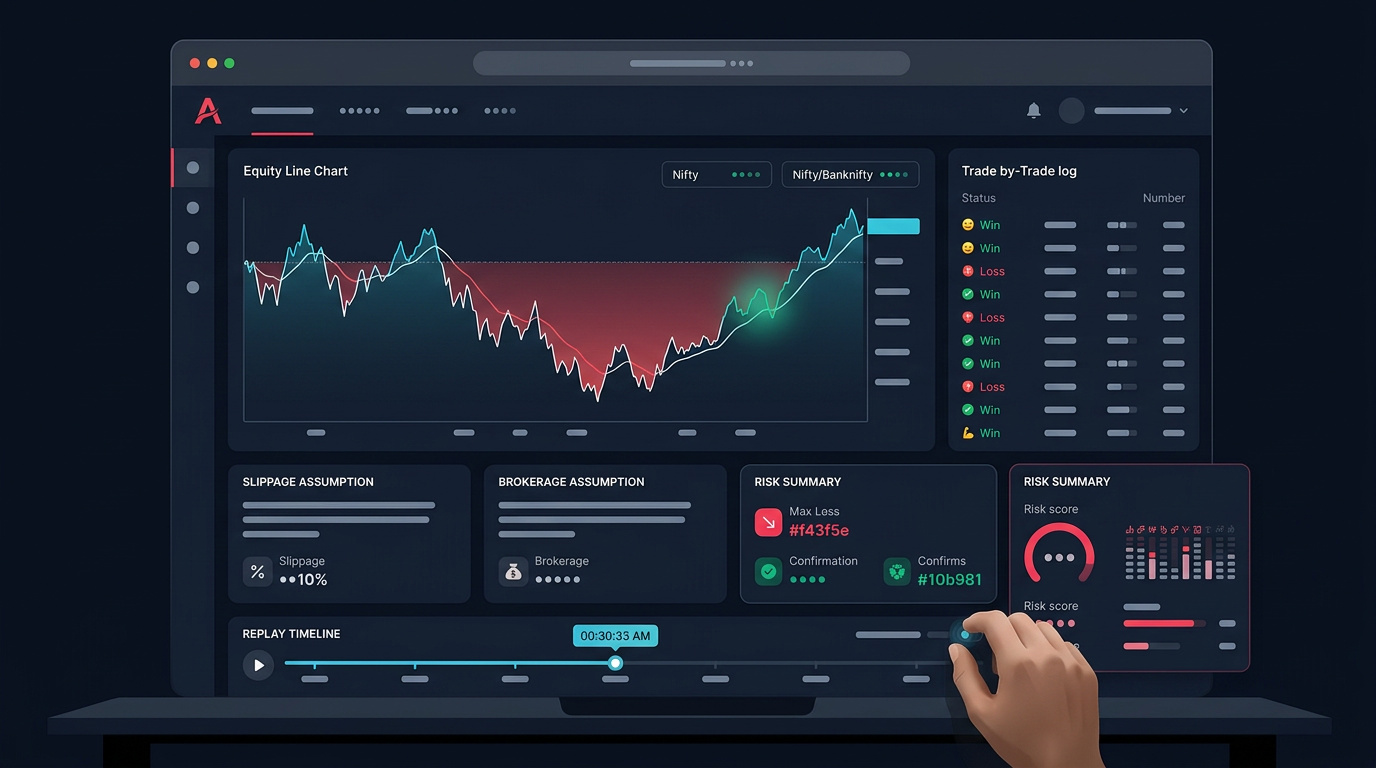
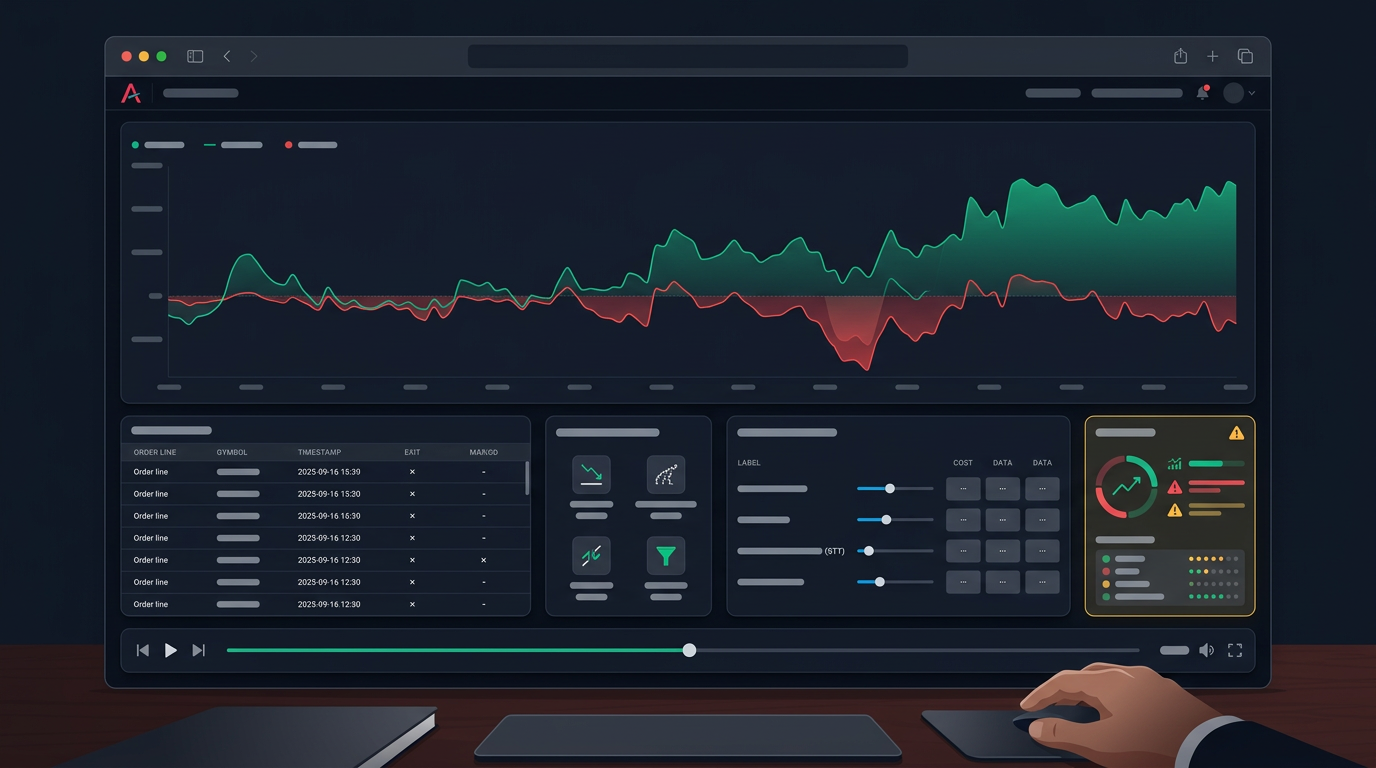
On Anadi's options backtesting wizard, the fee and fill settings sit inside the Period & Parameters and Risk steps, so the cost model is part of the test, not an afterthought.
Choose a fill model you can defend
A backtest that fills every order at the mid price is optimistic. More honest options:
- Fill at the far side of the spread — you pay to cross.
- Add a fixed slippage buffer per leg, larger for weekly expiries and illiquid strikes.
- For limit-order strategies, model missed fills — count the trades you would not have got.
Stress the assumptions
Re-run the backtest with costs at 1.5x and 2x your base assumption. If the edge only survives at zero cost, it is not an edge; it is an artifact. A robust system stays net positive even when you are pessimistic about friction.
Where costs hide the most
- High-frequency intraday systems. More trades means more round trips means more total friction. A scalping edge of a few points rarely survives honest costs.
- Far OTM and illiquid strikes. Tight theoretical edge, wide real spreads.
- Expiry-day trades. Fast tape, thin books at odd strikes, and slippage that spikes exactly when you need a clean fill.
- Backtests on stale or synthetic option data. If the premium series is modelled rather than traded, your fills were never real to begin with.
Rule-based and scanner-driven systems are not exempt. A clean signal from a scanner does not change what the order book charges you to act on it. Cost realism is part of risk management, not a separate accounting chore.
The cost-realism checklist
Before you trust any options backtest:
- Did I model the full charge stack, not just brokerage?
- Is my fee assumption calibrated to a real contract note?
- Does my fill model cross the spread instead of assuming mid?
- Did I add extra slippage for weekly expiry and illiquid strikes?
- For limit orders, did I account for missed fills?
- Does the edge survive at 1.5x and 2x cost?
- Is net PnL, not gross, driving my go/no-go decision?
If a strategy passes all seven, you have something worth taking to paper trading before risking capital. If it only survives on gross, you have found an expensive way to learn about transaction costs.
Want to test strategies with cost and fill assumptions built into the workflow instead of bolted on later? Get early access and run your next options backtest against net PnL from the start.
The takeaway: gross PnL tells you the market moved your way. Net PnL tells you whether you can keep the money. In Indian options, the distance between the two is measured in slippage and charges — model both, or the market will model them for you.