Earnings season is the one period where a well-behaved system can look broken for reasons that have nothing to do with its logic. Q2 FY27 results are still landing across NSE and BSE, a dozen-plus companies report on some days, and the tape swings on things your strategy file has never heard of — a US midterm result, a crude move, an auction-session tweak, a single large-cap guidance line.
Dashboards like MarketByte, the India Earnings Tracker and the big financial-paper live blogs exist to compress that into a two-minute read. They are genuinely useful. The problem starts when traders take a human-readable summary — "13 companies reported, 8 beat estimates" — and treat it as if it were a tradable input.
This post is about the gap between those two things. Not what to trade this week, but what to change in your process so that an earnings-heavy tape does not quietly rewrite your risk.
What this week's tape actually looked like
A few numbers from the last few sessions, purely as context — index levels move, so treat these as a snapshot and not a reference price:
- Nifty 50 printed around the 25,000–25,250 band, with one session showing a roughly 2% move and another barely 0.5%.
- Sensex traded near 81,000 after a session that added over 1,700 points.
- Nifty Bank was near 59,000 on a strong day, up over 2%.
- Nifty IT moved about 0.4% on the same day banks moved 2%+.
- Nifty Smallcap 50 closed slightly negative while large caps rallied.
Read those last three lines again. On a day the headline index jumped 2%, IT barely participated and small caps went the other way. That single-day spread is the whole point of this article.
If your strategy is index-driven but your execution universe is mid and small caps, a green Nifty headline told you almost nothing that day. If your system sizes off India VIX or index range, it saw a regime shift. If it trades a sector basket, it saw two completely different markets depending on which basket you held.
The same week also carried a festive calendar (Diwali and Dhanteras sessions), reported volatility around an expiry day, and global cues swinging on US midterm election outcomes. That is four unrelated variance sources stacked on top of normal earnings flow.
"Beat estimates" is a comparison, not a verdict
MarketByte itself makes this point in one of its explainers, and it is worth repeating because so many retail systems get it backwards: a beat is a company's number measured against a consensus of analyst forecasts. It is not a measure of business quality, and it is not a measure of what the stock will do.
Three reasons it breaks as an algo input:
The baseline is soft. Estimates get revised in the days before a result. A company can "beat" a number that was cut twice in the previous fortnight. Your feed sees a beat; the market saw a downgrade cycle.
Coverage is uneven. A Nifty 50 name has dozens of analysts and a tight consensus. A mid-cap F&O name might have four. "Beat" means something different in those two cases, and most free feeds do not expose the spread.
Price already moved. By the time a plain-English summary says "ahead of estimates," the gap has often happened. A rule that buys beats and sells misses is usually a rule that chases.
What is worth logging instead
If you want earnings data in your system, log facts with stable definitions rather than verdicts:
- Result date and time — pre-market, during-market, or post-market. This is the single most useful field.
- Confirmed vs tentative — board-meeting intimations shift. Treat unconfirmed dates as a wider blackout, not a precise one.
- Realised move on result day — the actual high-low range and close-to-close move, as a multiple of that symbol's normal 20-day range.
- Overnight gap — for post-market results, the next session's open versus previous close.
- Whether your strategy had a position through it.
That last field is the one most traders never record, and it is the one that explains their worst months. Our longer write-up on earnings data feeds for Nifty algo risk checks goes deeper on feed hygiene; this post is about what you do with the data once you trust it.
Build an earnings blackout your system can actually read
A calendar you check manually at 9:10 am is not a risk control. It is a hope. The control is a list your strategy consults before it is allowed to place an order.
Symbol-level rules
Keep it boring and explicit:
- No fresh positional entries in a symbol from the session before its result date through the session after.
- Intraday entries allowed only if the result is post-market and your exit is time-bound before close.
- If a position is already open and a result date gets announced mid-hold, the position moves to exit-only — no adds, no averaging.
- Reduce size, not stops. Widening a stop to "survive" an earnings gap is the same as not having a stop.
The size point deserves emphasis. If your normal risk per trade is 1% of capital, an earnings-window trade at half size risks 0.5% — but only if the stop holds. Gaps do not respect stops. Assume the realistic worst case on a post-market result is the gap, not your stop distance, and size from that number.
Index-level rules
Index strategies do not get a free pass. On heavy reporting days, a handful of large weights can drive the index while breadth stays flat — exactly what the IT-up, banks-down and banks-up, IT-flat sessions showed this week.
Useful index-side checks:
- Weight concentration: how much of the index weight reports in the next three sessions? If it is a meaningful chunk, your index strategy is effectively holding single-name event risk.
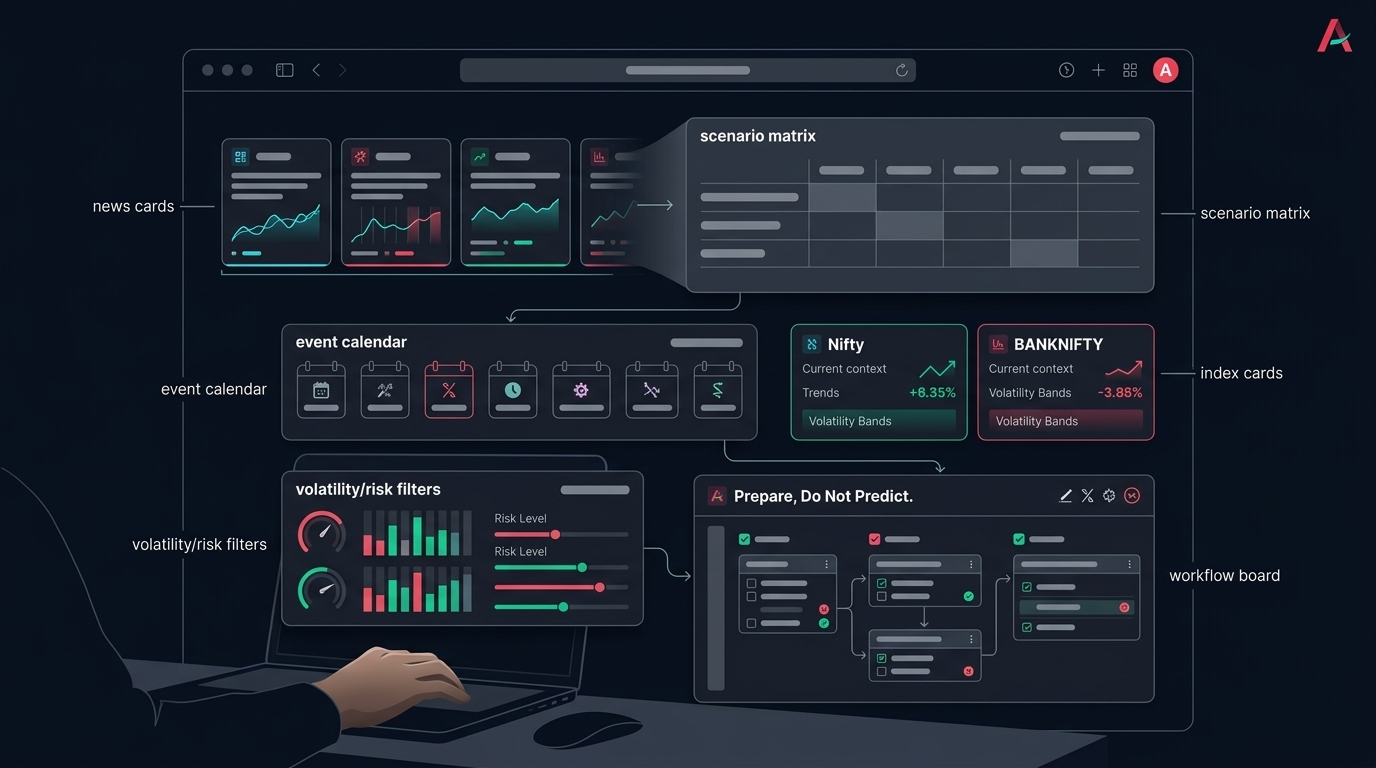
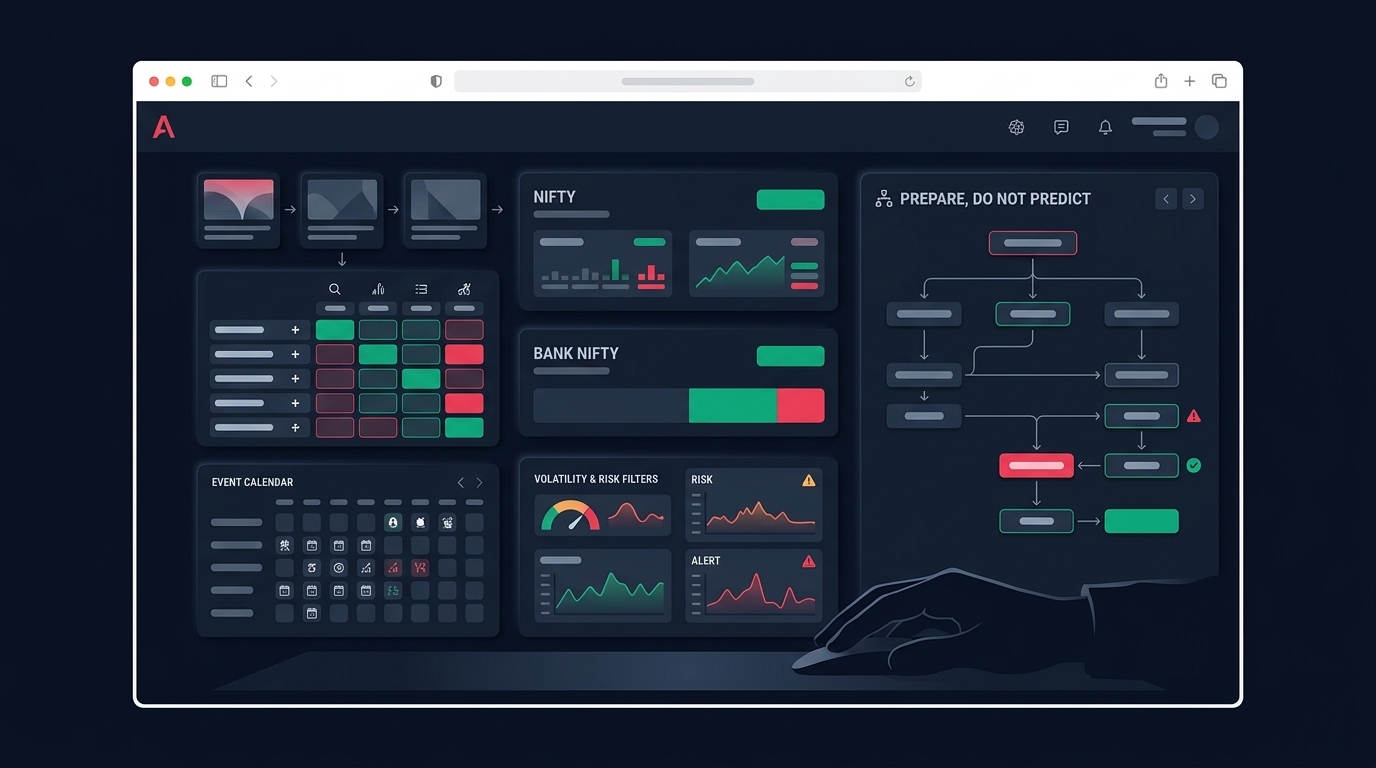
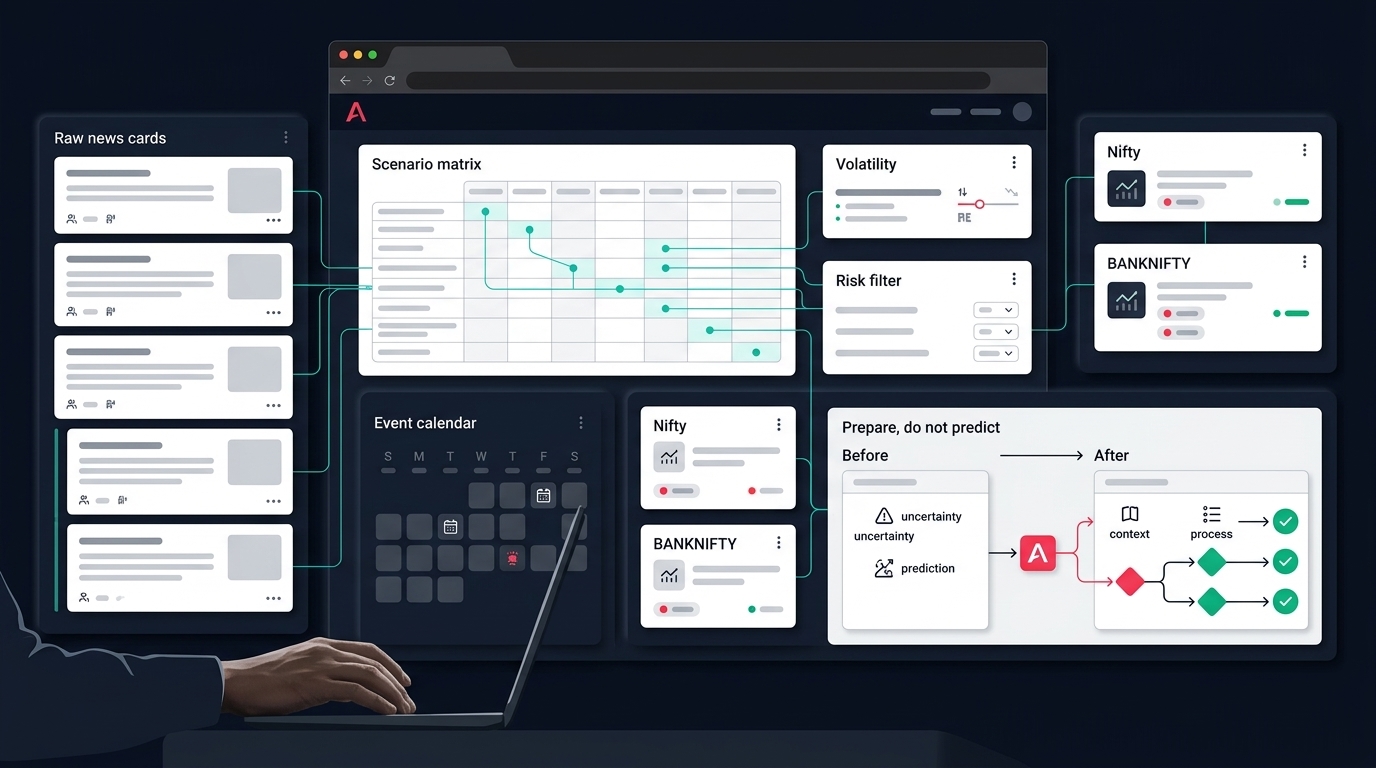
- Breadth vs headline: if the index is up but advance-decline and sector participation are narrow, continuation logic is on thin ice. Index cards and a sector heatmap are context for this, which is why Anadi puts them in front of the scanner rather than after it.
- Event stacking: result cluster plus expiry plus a global event in the same week means fewer trades, not more.
FII/DII flows are regime context, not an entry trigger
The daily line "domestic institutions bought while foreign investors trimmed exposure" shows up in almost every market wrap, and it genuinely explains range-bound tape. It is also published after the close, provisional, and revised.
So: useful as a slow-moving regime flag, useless as a trigger.
A reasonable way to use it:
- Track the rolling direction over 5 and 20 sessions rather than reacting to one day.
- Treat persistent two-sided flow (one side buying, the other selling) as a mean-reversion-friendly, breakout-hostile regime — and note that as context, not as a prediction. Your backtest should tell you whether your edge actually behaves differently in those windows.
- Never use a provisional number as a same-session input. If your logic depends on data published at 6 pm, it cannot drive a 10 am decision.
Session-structure changes need their own check
One detail from this week's coverage: market reports referenced volatility around a newly introduced closing auction session on an expiry day. Treat the mechanics of that as something to verify in exchange and broker circulars, not from a news summary — but treat the implication as real and immediate.
Anything that changes how the closing price is formed touches:
- Square-off timing for intraday systems that exit "at close."
- Settlement and mark-to-market reference prices.
- Expiry-day option behaviour in the final minutes.
- Backtest assumptions — historical close-price data was formed under the old mechanism.
This is the category of risk that no amount of strategy optimisation protects you from. The fix is procedural: read circulars from your exchange and broker, confirm what your broker's own square-off timer does, and move your intraday exits earlier than the last possible minute while you are still learning the new behaviour. Our risk management notes cover the guardrail side of this in more detail.
Backtest checks worth running before, not after
Earnings season is when backtest-to-live divergence shows up hardest. Three checks that take an hour and save a month:
Split your results by event window. Re-run your strategy with all earnings-window trades excluded, then with only those trades. If the no-earnings version is clearly steadier, your edge is not an event edge and your live rules should say so.
Re-examine gap handling. Many backtest engines fill at the signal price or the next bar's open with no slippage penalty. On a result-day gap, both are optimistic. Add an explicit gap-slippage assumption and see what survives.
Check your expiry-week overlap. Results clustering into an expiry week changes option behaviour — IV crush timing, bid-ask width, and liquidity at far strikes. If your strategy builder rules assume stable spreads, test what a widening spread does to a multi-leg basket's realised cost.
Scanner and execution hygiene in a results week
A scanner in earnings season produces more signals, not better ones. Volatility inflates breakout counts, volume spikes, and range expansions — most of them event artefacts.
Filters that help:
- Tag every candidate with its earnings proximity and drop or demote anything inside the blackout window.
- Add a chase-distance block: if price has already run a defined multiple of ATR from the trigger level, the entry is stale regardless of how good the pattern looks.
- Require sector and breadth confirmation before acting on a single-stock signal. A strong stock in a weak sector during a results week is usually a liquidity event, not a trend.
- For F&O-eligible names, check whether the option route is actually cheaper in risk terms than the cash route — and check the chain before deciding, not after.
This is the logic behind an action queue sitting between a scanner and execution: raw rows get ranked, blocked reasons get shown, and the trader sees why a signal was rejected. Whether you use Anadi's Action Center or your own spreadsheet, the principle is the same — the filter must be written down before the session, because nobody applies a filter well at 9:20 am.
On the options side, the sequence that keeps you honest is chain inspection, then strike and structure selection, then basket preview, then margin estimate, then order. In a high-IV results week the margin number moves a lot, and seeing it before execution rather than after is the difference between a planned trade and a surprise.
Your earnings-season checklist
Run this once a week and once each morning:
- Pull the confirmed result calendar for every symbol in your universe for the next five sessions. Mark confirmed vs tentative.
- Compute index weight at risk — what percentage of index weight reports this week.
- Set blackout flags in your strategy config, not in your head.
- Halve size for anything that must trade inside a window, and size from gap risk rather than stop distance.
- Check the event stack — results plus expiry plus a known global event means fewer positions.
- Verify session mechanics from exchange and broker circulars, especially around closing and expiry timing.
- Confirm your intraday square-off time is earlier than the broker's auto square-off, with buffer.
- Log one line per result-day trade: expected move, realised move, whether you held through it.
- Review FII/DII direction on a rolling basis as context only.
- At week's end, read your log, not the news. Did your rules hold, or did you override them?
None of this predicts anything. That is the point. In a week where the headline index can move 2% on global politics while small caps go nowhere, the only thing you control is how much the noise is allowed to cost you.
If you want to keep market context and trading rules in one place — scanner filters, event blackouts, option chain checks, backtests and paper execution — you can request early access and set this up as a workflow instead of a morning scramble. And if you prefer to start with context, the weekly market outlook is meant for exactly this: preparation, not trade calls.